\n
## Chart: Distribution of PRM Scores - Correct vs. Incorrect
### Overview
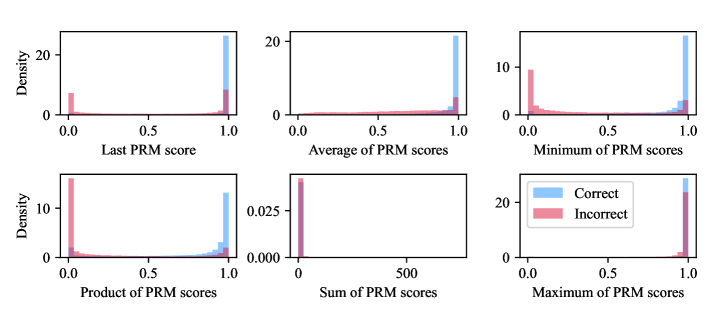
The image presents a 2x3 grid of density plots, each visualizing the distribution of a different PRM (presumably Peptide Retention Measurement) score metric for two categories: "Correct" and "Incorrect". Each plot displays density on the y-axis and a PRM score metric on the x-axis. The legend, located in the bottom-right corner, distinguishes between the "Correct" (blue) and "Incorrect" (red) categories.
### Components/Axes
* **X-axis (all plots):** Represents the PRM score metric. The scales vary per plot.
* **Y-axis (all plots):** Represents Density, ranging from approximately 0 to 20 (top row) or 0 to 10 (top-right) or 0 to 0.025 (bottom-middle).
* **Legend (bottom-right):**
* "Correct" - Blue
* "Incorrect" - Red
* **Plot Titles:**
* Top-left: "Last PRM score"
* Top-middle: "Average of PRM scores"
* Top-right: "Minimum of PRM scores"
* Bottom-left: "Product of PRM scores"
* Bottom-middle: "Sum of PRM scores"
* Bottom-right: "Maximum of PRM scores"
### Detailed Analysis or Content Details
**1. Last PRM score:**
* The "Incorrect" distribution (red) is bimodal, with peaks around 0.0 and 1.0.
* The "Correct" distribution (blue) is concentrated near 1.0, with a small peak around 0.0.
* Approximate values: "Incorrect" peaks at x ≈ 0.0 and x ≈ 1.0, density ≈ 18. "Correct" peak at x ≈ 1.0, density ≈ 15.
**2. Average of PRM scores:**
* Both "Incorrect" (red) and "Correct" (blue) distributions are concentrated near 1.0.
* The "Incorrect" distribution has a wider spread and a slight peak around 0.5.
* Approximate values: "Incorrect" peak at x ≈ 1.0, density ≈ 18. "Correct" peak at x ≈ 1.0, density ≈ 19.
**3. Minimum of PRM scores:**
* The "Incorrect" distribution (red) is concentrated near 0.0, with a long tail extending towards 1.0.
* The "Correct" distribution (blue) is concentrated near 1.0.
* Approximate values: "Incorrect" peak at x ≈ 0.0, density ≈ 9. "Correct" peak at x ≈ 1.0, density ≈ 6.
**4. Product of PRM scores:**
* The "Incorrect" distribution (red) is concentrated near 0.0, with a long tail extending towards 1.0.
* The "Correct" distribution (blue) is concentrated near 1.0.
* Approximate values: "Incorrect" peak at x ≈ 0.0, density ≈ 10. "Correct" peak at x ≈ 1.0, density ≈ 4.
**5. Sum of PRM scores:**
* The "Incorrect" distribution (red) is spread out from 0 to approximately 500, with a peak near 0.
* The "Correct" distribution (blue) is concentrated near 1.0, with a small peak around 500.
* Approximate values: "Incorrect" peak at x ≈ 0, density ≈ 0.02. "Correct" peak at x ≈ 1, density ≈ 0.015.
**6. Maximum of PRM scores:**
* The "Incorrect" distribution (red) is bimodal, with peaks around 0.0 and 1.0.
* The "Correct" distribution (blue) is concentrated near 1.0.
* Approximate values: "Incorrect" peaks at x ≈ 0.0 and x ≈ 1.0, density ≈ 18. "Correct" peak at x ≈ 1.0, density ≈ 15.
### Key Observations
* The "Incorrect" category consistently shows a higher density of values near 0.0 for several metrics (Last, Product, Minimum).
* The "Correct" category consistently shows a higher density of values near 1.0 for most metrics.
* The "Sum of PRM scores" plot is significantly different in scale compared to the others, with the x-axis ranging up to 500.
* The "Incorrect" distribution for the "Sum of PRM scores" is much broader and extends to higher values than the "Correct" distribution.
### Interpretation
The data suggests that the PRM scores can be used to differentiate between "Correct" and "Incorrect" classifications. Metrics like "Last PRM score", "Minimum of PRM scores", "Product of PRM scores", and "Maximum of PRM scores" appear to be particularly informative, as they exhibit clear separation between the two categories. A low value for these metrics is strongly associated with the "Incorrect" category.
The "Average of PRM scores" shows less separation, indicating that averaging may reduce the discriminatory power. The "Sum of PRM scores" plot is an outlier, with a very different scale and distribution. The broader distribution of the "Incorrect" category for the sum suggests that incorrect classifications may involve a wider range of total PRM scores.
The bimodal distributions observed in several plots for the "Incorrect" category suggest that there might be two distinct types of incorrect classifications, one with low PRM scores and another with high PRM scores. Further investigation would be needed to understand the nature of these two types. The consistent concentration of "Correct" classifications near 1.0 suggests that a high PRM score is a strong indicator of correctness.