TECHNICAL ASSET FINGERPRINT
90d93675c48581851991ad30
Click to view fullscreen
Press ESC or click to close
FOUND IN PAPERS
EXPERT: healer-alpha-free VERSION 1
RUNTIME: free/openrouter/healer-alpha
INTEL_VERIFIED
## Density Plots: Distribution of PRM Scores by Correctness
### Overview
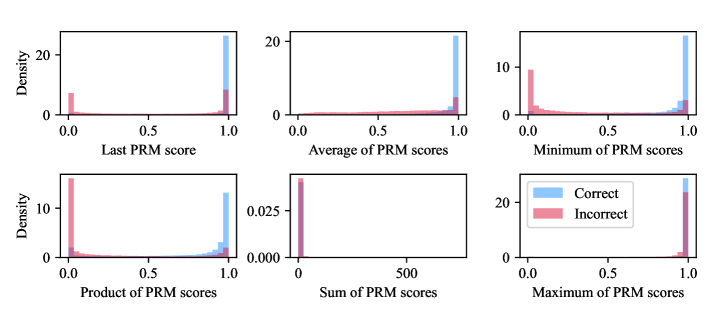
The image displays a 2x3 grid of six density plots (histograms). Each plot visualizes the distribution of a different metric derived from "PRM scores" for two categories: "Correct" and "Incorrect" outcomes. The plots compare how these score metrics differ between correct and incorrect results.
### Components/Axes
* **Layout:** Six subplots arranged in two rows and three columns.
* **Common Y-Axis:** All plots share the y-axis label **"Density"**, indicating the frequency or probability density of the scores. The scale varies per plot.
* **Common X-Axis Range:** All plots have an x-axis ranging from **0.0 to 1.0**, except for the "Sum of PRM scores" plot, which ranges from **0 to 500**.
* **Legend:** Located in the top-right corner of the bottom-right subplot ("Maximum of PRM scores").
* **Blue Square:** Labeled **"Correct"**.
* **Red Square:** Labeled **"Incorrect"**.
* **Subplot Titles (X-Axis Labels):**
1. Top-Left: **"Last PRM score"**
2. Top-Center: **"Average of PRM scores"**
3. Top-Right: **"Minimum of PRM scores"**
4. Bottom-Left: **"Product of PRM scores"**
5. Bottom-Center: **"Sum of PRM scores"**
6. Bottom-Right: **"Maximum of PRM scores"**
### Detailed Analysis
**1. Last PRM score (Top-Left)**
* **Incorrect (Red):** Distribution is heavily skewed toward **0.0**, with a very high, narrow peak at the lowest value. Density drops sharply as the score increases.
* **Correct (Blue):** Distribution is heavily skewed toward **1.0**, with a very high, narrow peak at the highest value. Density is near zero for scores below ~0.8.
* **Trend:** A stark, bimodal separation. Incorrect outcomes are associated with a final PRM score near 0, while correct outcomes are associated with a final score near 1.
**2. Average of PRM scores (Top-Center)**
* **Incorrect (Red):** Distribution is concentrated near **0.0**, with a peak at the low end. There is a very slight, long tail extending toward higher scores.
* **Correct (Blue):** Distribution is concentrated near **1.0**, with a sharp peak at the high end. There is a very slight tail extending toward lower scores.
* **Trend:** Similar to the "Last score" plot but slightly less extreme separation. The average score strongly correlates with correctness.
**3. Minimum of PRM scores (Top-Right)**
* **Incorrect (Red):** Distribution has a dominant peak at **0.0** and a smaller, secondary peak near **1.0**. This suggests many incorrect outcomes have at least one very low score.
* **Correct (Blue):** Distribution has a dominant peak at **1.0** and a smaller, secondary peak near **0.0**. This suggests most correct outcomes have all scores high, but a subset contains at least one low score.
* **Trend:** Both categories show bimodal distributions, but the primary mass is inverted. The presence of a low minimum score is more indicative of an incorrect outcome.
**4. Product of PRM scores (Bottom-Left)**
* **Incorrect (Red):** Extremely concentrated peak at **0.0**. The product is near zero for almost all incorrect cases.
* **Correct (Blue):** Extremely concentrated peak at **1.0**. The product is near one for almost all correct cases.
* **Trend:** The most extreme separation of all plots. The product of scores appears to be a near-perfect classifier in this data.
**5. Sum of PRM scores (Bottom-Center)**
* **Incorrect (Red):** Distribution is a sharp peak at **0**. The sum is very low for incorrect outcomes.
* **Correct (Blue):** Distribution is a sharp peak at a high value (approximately **450-500**, based on the x-axis scale). The sum is very high for correct outcomes.
* **Trend:** Shows a clear separation in magnitude. Correct outcomes have a much higher total sum of scores.
**6. Maximum of PRM scores (Bottom-Right)**
* **Incorrect (Red):** Distribution has a small peak near **0.0** and a larger peak at **1.0**. Many incorrect outcomes still achieve a high maximum score.
* **Correct (Blue):** Distribution is almost entirely a single, sharp peak at **1.0**. Nearly all correct outcomes have a maximum score of 1.
* **Trend:** The maximum score is less discriminative than other metrics. While a correct outcome almost guarantees a max score of 1, an incorrect outcome can also frequently achieve it.
### Key Observations
1. **Bimodality:** Most distributions (Last, Min, Product, Max) are bimodal, with mass concentrated at the extremes (0.0 and 1.0).
2. **Discriminative Power:** The **"Product of PRM scores"** shows the cleanest separation between classes, followed by the **"Last PRM score"** and **"Sum of PRM scores"**.
3. **Weak Discriminator:** The **"Maximum of PRM scores"** is the weakest discriminator, as both correct and incorrect outcomes frequently have a maximum score of 1.0.
4. **Incorrect Profile:** Incorrect outcomes are characterized by: a last score near 0, a low average, a high likelihood of containing at least one very low score (low min), a product near 0, and a low sum.
5. **Correct Profile:** Correct outcomes are characterized by: a last score near 1, a high average, a high likelihood of all scores being high (high min), a product near 1, and a high sum.
### Interpretation
This analysis suggests that PRM (likely "Process Reward Model") scores are highly indicative of final outcome correctness, but the *way* they are aggregated matters significantly.
* **The "Product" metric is paramount.** Its near-perfect separation implies that if *any* step in the process receives a low PRM score (approaching 0), the product collapses to near zero, strongly predicting an incorrect outcome. This aligns with a "weakest link" or "single point of failure" model of reasoning or generation.
* **Temporal signals matter.** The strong performance of the "Last PRM score" indicates that the model's final evaluation is highly predictive. A low final score is a strong red flag.
* **Aggregates reveal different facets.** The "Sum" and "Average" show that correct outcomes have consistently higher scores across the board. The "Minimum" plot reveals that while correct outcomes *usually* have all high scores, a notable subset contains a flaw (a low score), yet still resulted in a correct answer. Conversely, some incorrect outcomes managed to have all high scores (high minimum), suggesting other failure modes.
* **Practical Implication:** For a system using these PRM scores, relying on the **product** or the **last score** would be the most reliable signals for flagging potential errors or certifying correctness. The maximum score alone is not trustworthy. The data supports a model where correctness is fragile and easily derailed by a single poorly-scored step, but also where a single flawed step does not *guarantee* failure.
DECODING INTELLIGENCE...