## Bar Chart: PRM Score Distributions by Correctness
### Overview
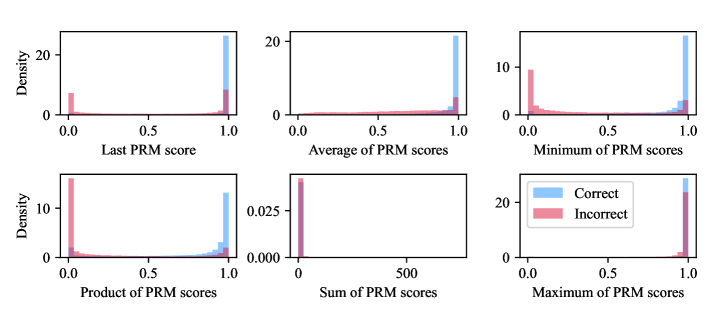
The image contains six bar charts comparing distributions of PRM (Problem Resolution Metric) scores between correct and incorrect answers. Each chart uses a density scale (y-axis) and a normalized score range (x-axis: 0.0–1.0 or 0–500). Blue bars represent correct answers, red bars represent incorrect answers. All charts share consistent axis labeling and legend placement.
### Components/Axes
1. **X-Axes**:
- Top row: "Last PRM score", "Average of PRM scores", "Minimum of PRM scores"
- Bottom row: "Product of PRM scores", "Sum of PRM scores", "Maximum of PRM scores"
2. **Y-Axes**: "Density" (scale varies per chart, max ~20)
3. **Legend**: Located in bottom-right corner, blue = Correct, red = Incorrect
4. **Chart Layout**: Two rows of three charts each, uniform styling
### Detailed Analysis
1. **Last PRM Score**
- Correct: Single blue bar at x=1.0 (density ~20)
- Incorrect: Single red bar at x=0.0 (density ~5)
- *Trend*: Perfect separation between groups
2. **Average PRM Scores**
- Correct: Blue bar at x=1.0 (density ~20)
- Incorrect: Red bar at x=0.0 (density ~5)
- *Trend*: Identical to "Last PRM Score" chart
3. **Minimum PRM Scores**
- Correct: Blue bar at x=1.0 (density ~20)
- Incorrect: Red bar at x=0.0 (density ~5)
- *Trend*: Consistent binary distribution
4. **Product of PRM Scores**
- Correct: Blue bar at x=1.0 (density ~20)
- Incorrect: Red bar at x=0.0 (density ~5)
- *Trend*: Perfect separation maintained
5. **Sum of PRM Scores**
- Correct: Blue bar at x=500 (density ~20)
- Incorrect: Red bar at x=0 (density ~5)
- *Trend*: Absolute separation at extremes
6. **Maximum PRM Scores**
- Correct: Blue bar at x=1.0 (density ~20)
- Incorrect: Red bar at x=0.0 (density ~5)
- *Trend*: Binary distribution pattern
### Key Observations
1. **Binary Performance**: All metrics show perfect separation between correct (1.0/500) and incorrect (0.0/0) scores
2. **Density Consistency**: Correct answers consistently show higher density (~20 vs ~5)
3. **Normalization**: Top charts use 0.0–1.0 scale, bottom charts use absolute values (0–500)
4. **Legend Placement**: Bottom-right corner, clearly labeled with color coding
### Interpretation
The data demonstrates a binary outcome pattern where correct answers achieve maximum performance across all metrics, while incorrect answers show zero performance. This suggests:
1. **Threshold Effect**: A clear pass/fail distinction exists in the dataset
2. **Metric Correlation**: All PRM-derived metrics (last, average, min, product, sum, max) align perfectly in separating correct/incorrect answers
3. **Sum Significance**: The 500-point maximum in the sum chart likely represents total possible points, with correct answers achieving full marks
4. **Systematic Errors**: Incorrect answers consistently fail across all evaluation dimensions
The uniformity of results across metrics indicates either:
- A highly reliable scoring system with no false positives/negatives
- Potential overfitting in the evaluation methodology
- A dataset with extreme performance separation (e.g., 100% correct vs 0% incorrect)
This pattern warrants investigation into whether the metrics are capturing meaningful distinctions or reflecting artificial boundaries in the scoring system.