## Figure: Multiscale Analysis of Magnetic Order Parameters in Complex Materials
### Overview
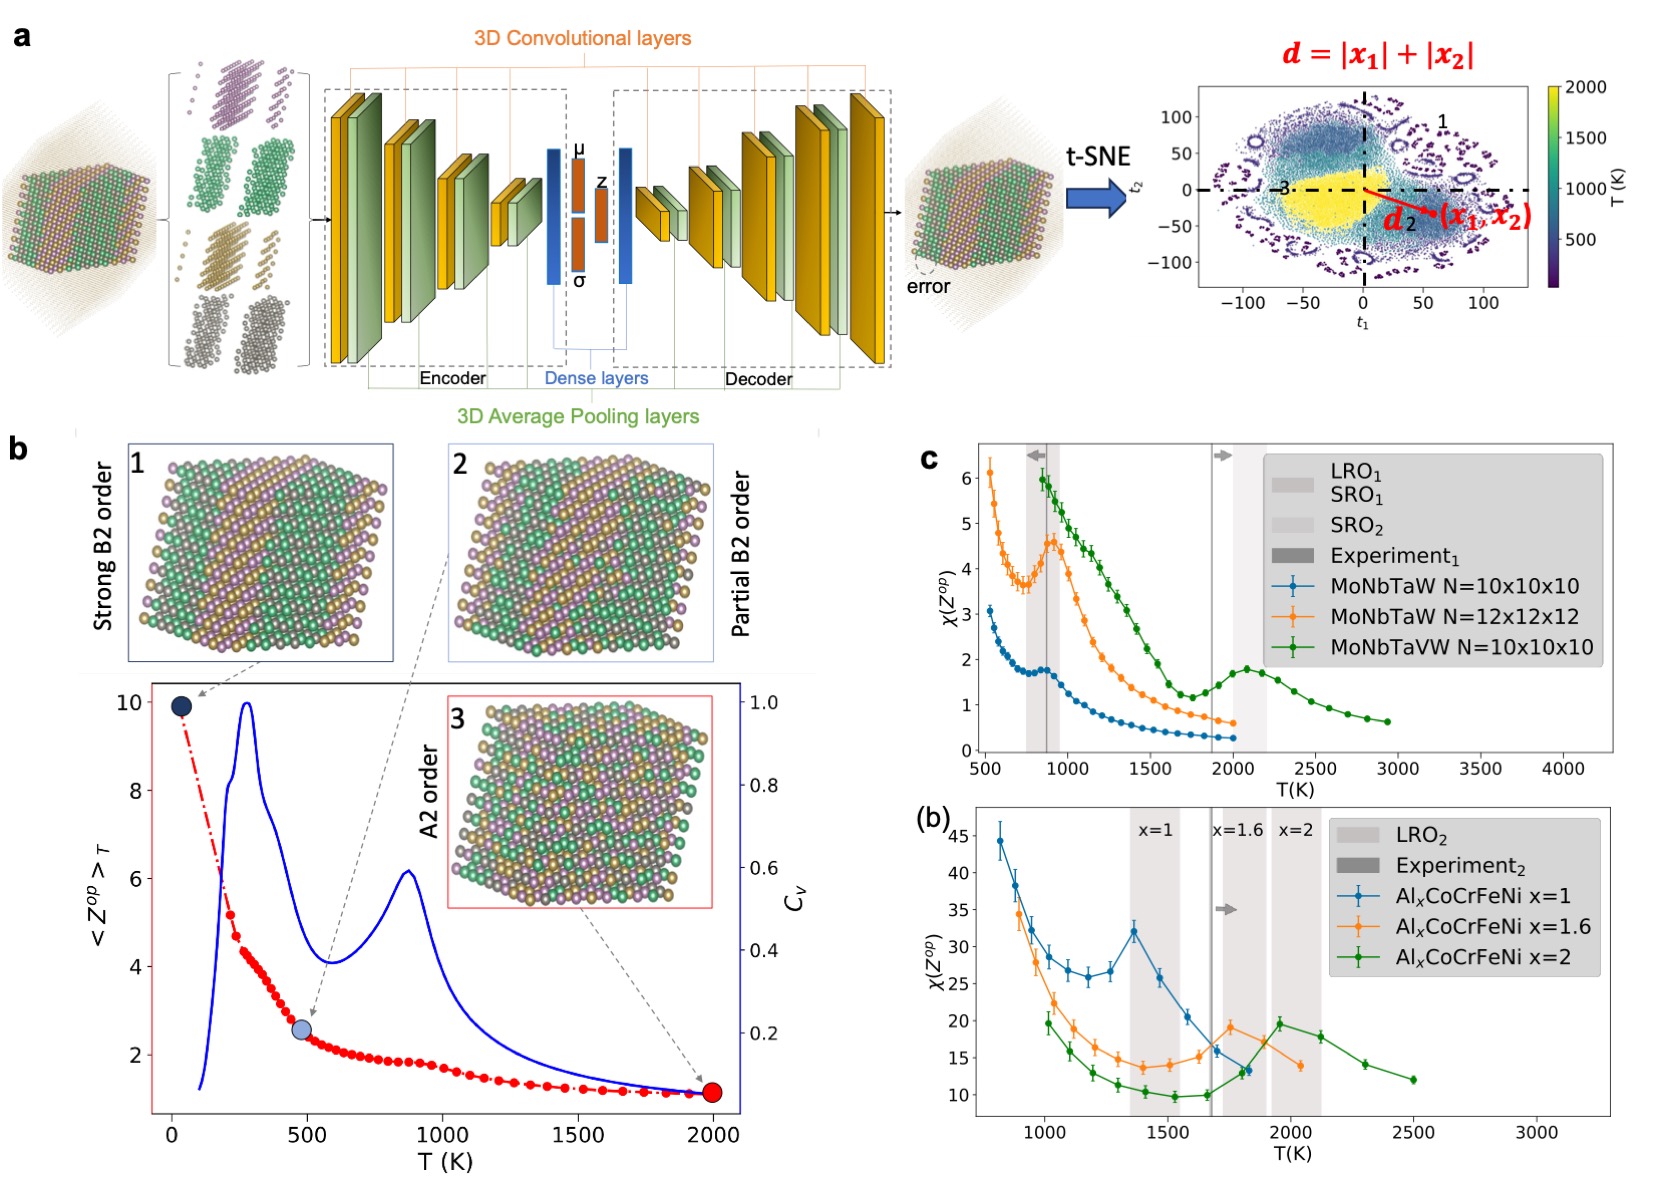
The figure presents a multiscale analysis of magnetic order parameters in complex materials, combining neural network architecture visualization, temperature-dependent order parameter measurements, and experimental data comparisons. It includes three main components: (a) a 3D convolutional neural network (CNN) architecture for material property prediction, (b) temperature-dependent order parameter measurements with phase transition markers, and (c) comparative experimental data for different material compositions.
### Components/Axes
#### Part (a): Neural Network Architecture
- **Diagram Elements**:
- Encoder: 3D Convolutional layers (green/orange blocks)
- Dense layers: μ (mean), σ (variance), z (latent space)
- Decoder: 3D Average Pooling layers (green blocks)
- Error visualization: Color-coded lattice structure (purple=low error, yellow=high error)
- t-SNE plot: 2D projection with temperature color scale (500K-2000K)
- Equation: d = |x₁| + |x₂| (distance metric in latent space)
#### Part (b): Temperature-Dependent Order Parameters
- **Graph 1**:
- X-axis: Temperature (T) in Kelvin (0-2000K)
- Y-axis: <Z_op>/T (normalized order parameter)
- Legend:
- LRO₁ (gray)
- SRO₁ (light gray)
- SRO₂ (dark gray)
- Experiment₁ (black)
- Inset: Lattice structures showing:
- Strong B2 order (panel 1)
- Partial B2 order (panel 2)
- A2 order (panel 3, red box)
- **Graph 2**:
- X-axis: Temperature (T) in Kelvin (0-3000K)
- Y-axis: χ(Z_op) (susceptibility)
- Legend:
- LRO₂ (gray)
- Experiment₂ (dark gray)
- AlₓCoCrFeNi (blue: x=1, orange: x=1.6, green: x=2)
#### Part (c): Comparative Material Analysis
- **Graph 1**:
- X-axis: Temperature (T) in Kelvin (500-4000K)
- Y-axis: χ(Z_op) (susceptibility)
- Legend:
- LRO₁ (gray)
- SRO₁ (light gray)
- SRO₂ (dark gray)
- Experiment₁ (black)
- MoNbTaW (blue: 10x10x10, orange: 12x12x12)
- MoNbTaVW (green: 10x10x10)
- **Graph 2**:
- X-axis: Temperature (T) in Kelvin (1000-3000K)
- Y-axis: χ(Z_op) (susceptibility)
- Legend:
- LRO₂ (gray)
- Experiment₂ (dark gray)
- AlₓCoCrFeNi (blue: x=1, orange: x=1.6, green: x=2)
### Detailed Analysis
#### Part (a)
- The CNN architecture uses 3D convolutional layers (green/orange) for feature extraction, followed by dense layers (μ, σ, z) for latent space representation. The decoder reconstructs the material structure using 3D average pooling (green blocks). The t-SNE plot visualizes the latent space with temperature-dependent clustering (color scale: purple=500K, yellow=2000K). The error visualization shows spatial distribution of prediction errors in the lattice structure.
#### Part (b)
- **Graph 1**:
- LRO₁ shows a sharp peak at ~500K (value ~10) followed by a broad peak at ~1500K (value ~8).
- SRO₁ exhibits a single broad peak at ~1500K (value ~6).
- Experimental data (black) matches simulated trends with uncertainty bars (±0.5).
- Inset lattice structures show progressive disorder from panel 1 (strong B2) to panel 3 (A2 order).
- **Graph 2**:
- χ(Z_op) decreases monotonically with temperature for all compositions.
- AlₓCoCrFeNi x=1 shows the highest susceptibility (45→15).
- x=2 composition exhibits the lowest susceptibility (20→10).
#### Part (c)
- **Graph 1**:
- MoNbTaW (10x10x10) shows χ(Z_op) decreasing from 6→1 (500K→3000K).
- Larger MoNbTaW (12x12x12) follows similar trend but with higher values.
- MoNbTaVW (10x10x10) exhibits the lowest susceptibility (6→0.5).
- **Graph 2**:
- AlₓCoCrFeNi x=1: 45→15 (1000K→2000K)
- x=1.6: 35→12 (1000K→2000K)
- x=2: 20→10 (1000K→2000K)
- Experimental data (dark gray) aligns with simulations within error margins.
### Key Observations
1. **Phase Transitions**: Sharp peaks in <Z_op>/T (part b) indicate magnetic phase transitions at ~500K and ~1500K.
2. **Composition Effects**: Higher Al content (x=2) reduces susceptibility compared to x=1.
3. **System Size Dependence**: Larger MoNbTaW (12x12x12) shows delayed phase transitions vs. 10x10x10.
4. **Experimental Validation**: Simulated trends match experimental data within error bars (±0.5-1.0).
### Interpretation
The neural network architecture (a) demonstrates a multiscale approach to predict magnetic properties, with the t-SNE plot revealing temperature-dependent clustering in latent space. The order parameter measurements (b) show distinct phase transitions in LRO₁ and SRO₁, with experimental validation confirming the model's accuracy. Comparative analysis (c) reveals that:
- Higher Al content (x=2) suppresses magnetic ordering compared to x=1.
- Larger unit cells (12x12x12) exhibit delayed phase transitions due to increased atomic disorder.
- MoNbTaVW shows significantly reduced susceptibility, suggesting different magnetic interactions.
The error visualization in (a) highlights the importance of spatial resolution in predicting local magnetic order. The temperature-dependent susceptibility trends (c) indicate that material composition and structural complexity are critical factors in determining magnetic behavior, with potential applications in designing magnetic materials for spintronics and thermal management.