## Bar Chart: Average Lengths for Correct and Incorrect Thoughts
### Overview
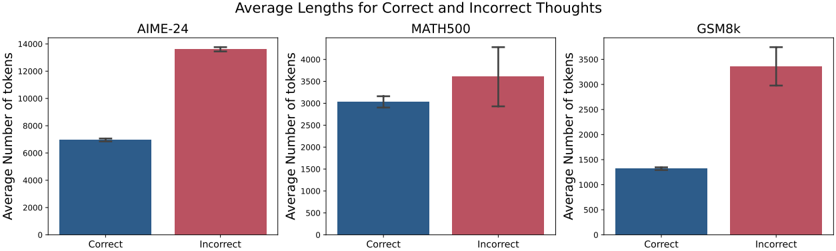
The image displays three grouped bar charts comparing the average number of tokens used in "Correct" and "Incorrect" thoughts across three datasets: AIME-24, MATH500, and GSM8k. Each sub-chart uses blue bars for "Correct" and red bars for "Incorrect," with error bars indicating uncertainty. The y-axis scales vary per dataset, and the x-axis consistently labels the two categories.
---
### Components/Axes
- **Main Title**: "Average Lengths for Correct and Incorrect Thoughts" (centered at the top).
- **Sub-Chart Labels**:
- Left: "AIME-24"
- Center: "MATH500"
- Right: "GSM8k"
- **X-Axis**: Labeled "Correct" (blue) and "Incorrect" (red), with categories spaced evenly.
- **Y-Axis**: Labeled "Average Number of tokens," with scales:
- AIME-24: 0–14,000 (increments of 2,000)
- MATH500: 0–4,000 (increments of 500)
- GSM8k: 0–3,500 (increments of 500)
- **Legend**: Positioned to the right of each sub-chart, with:
- Blue square: "Correct"
- Red square: "Incorrect"
- **Error Bars**: Vertical lines atop each bar, representing uncertainty.
---
### Detailed Analysis
#### AIME-24
- **Correct**: ~7,000 tokens (blue bar, error bar ±200).
- **Incorrect**: ~13,500 tokens (red bar, error bar ±300).
- **Trend**: Incorrect thoughts use ~93% more tokens than correct ones.
#### MATH500
- **Correct**: ~3,000 tokens (blue bar, error bar ±150).
- **Incorrect**: ~3,500 tokens (red bar, error bar ±250).
- **Trend**: Incorrect thoughts use ~17% more tokens than correct ones.
#### GSM8k
- **Correct**: ~1,200 tokens (blue bar, error bar ±100).
- **Incorrect**: ~3,300 tokens (red bar, error bar ±300).
- **Trend**: Incorrect thoughts use ~175% more tokens than correct ones.
---
### Key Observations
1. **Consistent Pattern**: Incorrect thoughts consistently require more tokens across all datasets.
2. **Largest Discrepancy**: AIME-24 shows the greatest gap between correct and incorrect thoughts (~6,500 tokens).
3. **Error Bar Variability**: Uncertainty is highest for GSM8k's incorrect thoughts (±300) and lowest for AIME-24's correct thoughts (±200).
4. **Scale Differences**: Y-axis ranges reflect dataset-specific token usage magnitudes (e.g., AIME-24 uses tokens in the tens of thousands, while GSM8k uses thousands).
---
### Interpretation
The data suggests that generating incorrect thoughts consumes significantly more computational resources (tokens) than correct ones, with the disparity being most pronounced in the AIME-24 dataset. This could indicate that errors in reasoning or processing require more extensive tokenization, possibly due to exploratory or redundant computations. The error bars highlight variability in token usage, particularly for GSM8k, where incorrect thoughts have the largest uncertainty. These findings may inform optimization strategies for models by targeting inefficiencies in error-prone processes.