## Bar Charts: Average Lengths for Correct and Incorrect Thoughts
### Overview
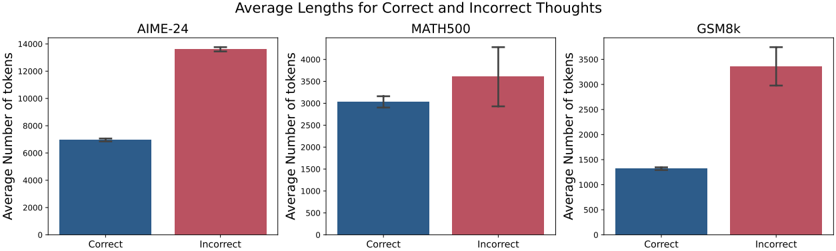
The image contains three bar charts comparing the average number of tokens for correct and incorrect "thoughts" across three different datasets: AIME-24, MATH500, and GSM8k. Each chart displays two bars, one for correct thoughts (blue) and one for incorrect thoughts (red), with error bars indicating variability.
### Components/Axes
* **Title:** Average Lengths for Correct and Incorrect Thoughts
* **Y-axis Label:** Average Number of tokens
* **X-axis Labels:** Correct, Incorrect
* **Chart Titles (Top of each chart):** AIME-24, MATH500, GSM8k
* **Bar Colors:** Blue (Correct), Red (Incorrect)
### Detailed Analysis
**AIME-24 Chart:**
* **Correct Thoughts (Blue):** The bar extends to approximately 7000 tokens.
* **Incorrect Thoughts (Red):** The bar extends to approximately 13500 tokens.
* **Trend:** Incorrect thoughts have a significantly higher average number of tokens compared to correct thoughts.
**MATH500 Chart:**
* **Correct Thoughts (Blue):** The bar extends to approximately 3000 tokens.
* **Incorrect Thoughts (Red):** The bar extends to approximately 3600 tokens.
* **Trend:** Incorrect thoughts have a slightly higher average number of tokens compared to correct thoughts. The error bar for incorrect thoughts is larger than for correct thoughts.
**GSM8k Chart:**
* **Correct Thoughts (Blue):** The bar extends to approximately 1300 tokens.
* **Incorrect Thoughts (Red):** The bar extends to approximately 3400 tokens.
* **Trend:** Incorrect thoughts have a significantly higher average number of tokens compared to correct thoughts.
### Key Observations
* In all three datasets, incorrect thoughts have a higher average number of tokens than correct thoughts.
* The difference in average token length between correct and incorrect thoughts is most pronounced in AIME-24 and GSM8k.
* The MATH500 dataset shows a smaller difference in average token length between correct and incorrect thoughts compared to the other two datasets.
### Interpretation
The data suggests that, across these three datasets, incorrect "thoughts" or solutions tend to be more verbose than correct ones, as measured by the number of tokens. This could indicate that incorrect solutions involve more steps, explanations, or exploration of wrong paths. The magnitude of this difference varies across datasets, potentially reflecting the nature of the problems or the solving strategies employed. The error bars indicate the variability in the length of thoughts, with MATH500 showing a larger variability for incorrect thoughts.