\n
## Bar Chart: Average Lengths for Correct and Incorrect Thoughts
### Overview
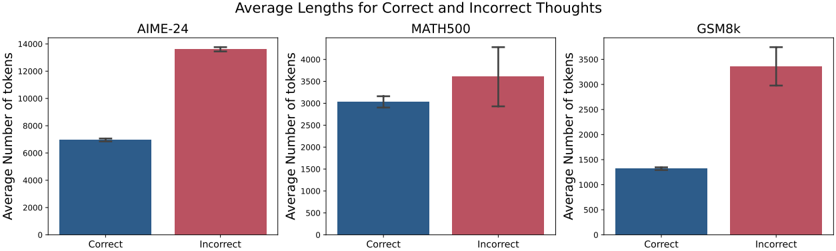
The image presents a bar chart comparing the average number of tokens used for correct versus incorrect "thoughts" across three different datasets: AIME-24, MATH500, and GSM8k. Each dataset is represented by a separate bar chart. Error bars are included on each bar, indicating the standard error or standard deviation.
### Components/Axes
* **Title:** "Average Lengths for Correct and Incorrect Thoughts" (centered at the top)
* **X-axis Label (all charts):** "Correct" and "Incorrect"
* **Y-axis Label (all charts):** "Average Number of tokens" (ranging from 0 to 14000, 0 to 4000, and 0 to 3500 for AIME-24, MATH500, and GSM8k respectively)
* **Datasets (Charts):** AIME-24, MATH500, GSM8k
* **Bar Colors:** Blue for "Correct" thoughts, Red for "Incorrect" thoughts.
* **Error Bars:** Black vertical lines indicating variability.
### Detailed Analysis
**AIME-24 (Left Chart)**
* The "Correct" bar (blue) has a height of approximately 6800 tokens ± 600 tokens (estimated from the error bar).
* The "Incorrect" bar (red) has a height of approximately 13800 tokens ± 400 tokens (estimated from the error bar).
* Trend: The "Incorrect" bar is significantly higher than the "Correct" bar.
**MATH500 (Center Chart)**
* The "Correct" bar (blue) has a height of approximately 2800 tokens ± 300 tokens (estimated from the error bar).
* The "Incorrect" bar (red) has a height of approximately 3600 tokens ± 500 tokens (estimated from the error bar).
* Trend: The "Incorrect" bar is higher than the "Correct" bar, but the difference is less pronounced than in AIME-24.
**GSM8k (Right Chart)**
* The "Correct" bar (blue) has a height of approximately 1300 tokens ± 200 tokens (estimated from the error bar).
* The "Incorrect" bar (red) has a height of approximately 3200 tokens ± 400 tokens (estimated from the error bar).
* Trend: The "Incorrect" bar is significantly higher than the "Correct" bar.
### Key Observations
* In all three datasets, incorrect thoughts tend to be longer (in terms of token count) than correct thoughts.
* The difference in length between correct and incorrect thoughts is most substantial in the AIME-24 dataset.
* The error bars suggest that the differences observed are statistically significant, although the magnitude of the error varies between datasets.
### Interpretation
The data suggests that when a model makes an incorrect prediction or generates an incorrect "thought," it tends to use more tokens than when it generates a correct one. This could indicate that incorrect reasoning processes are more verbose or involve more complex (and ultimately flawed) chains of thought. The larger difference in AIME-24 might suggest that this dataset presents more challenging problems where incorrect solutions require significantly more exploration and, therefore, more tokens. The GSM8k dataset also shows a large difference, indicating similar behavior. The MATH500 dataset shows a smaller difference, potentially indicating that incorrect solutions are not as drastically different in length from correct ones in this domain. This could be due to the nature of the mathematical problems in MATH500, where errors might be simpler and require less extensive incorrect reasoning. The error bars provide a measure of the variability within each group, allowing for an assessment of the reliability of the observed differences.