## Line Charts: Multi-Variable Analysis of Event Distributions and Elite Concentration
### Overview
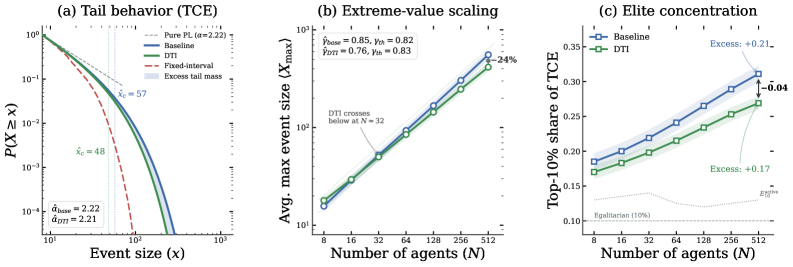
Three comparative line charts analyze different aspects of event distributions and elite concentration across agent-based systems. Panel (a) examines tail behavior, panel (b) shows extreme-value scaling, and panel (c) tracks elite concentration dynamics. All charts use logarithmic scales for quantitative precision.
### Components/Axes
**Panel (a): Tail Behavior (TCE)**
- X-axis: Event size (x) [log scale, 10¹ to 10³]
- Y-axis: P(X ≥ x) [log scale, 10⁻⁴ to 10⁰]
- Legend:
- Pure PL (α=2.22) - dashed gray
- Baseline - solid blue
- DTI - solid green
- Fixed-interval - dashed red
- Excess tail mass - shaded blue
- Spatial grounding: Legend positioned right, χ_c markers (48/57) annotated near curves
**Panel (b): Extreme-value scaling**
- X-axis: Number of agents (N) [log scale, 8 to 512]
- Y-axis: Avg. max event size (X_max) [log scale, 10¹ to 10³]
- Legend:
- Baseline - blue circles
- DTI - green circles
- Spatial grounding: Legend right, crossover marker at N=32
**Panel (c): Elite concentration**
- X-axis: Number of agents (N) [log scale, 8 to 512]
- Y-axis: Top-10% share of TCE [linear scale, 0.1 to 0.35]
- Legend:
- Baseline - blue squares
- DTI - green squares
- Excess - shaded blue
- Egalitarian (10%) - dashed gray
- Spatial grounding: Legend right, excess annotations (+0.17/+0.21) near curves
### Detailed Analysis
**Panel (a) Trends:**
- Pure PL (dashed gray) shows steepest decay, with χ_c=57
- DTI (solid green) demonstrates faster tail decay (χ_c=48)
- Baseline (solid blue) has α=2.22 vs DTI's α=2.21
- Fixed-interval (dashed red) intersects DTI at ~x=10²
- Excess tail mass (shaded blue) spans x=10¹ to 10²
**Panel (b) Trends:**
- Both models show logarithmic growth in X_max with N
- Baseline (blue) consistently outperforms DTI (green)
- DTI crosses below Baseline at N=32 (24% excess)
- γ values: Baseline=0.82 vs DTI=0.83
**Panel (c) Trends:**
- Both models show linear increase in elite concentration
- Baseline reaches 0.32 at N=512 (24% excess)
- DTI reaches 0.27 at N=512 (17% excess)
- Egalitarian line (10%) remains constant
### Key Observations
1. DTI demonstrates superior tail behavior (lower χ_c) but lags in extreme-value scaling after N=32
2. Baseline maintains higher elite concentration growth (+24% vs +17%)
3. Fixed-interval model shows critical intersection with DTI at mid-scale events
4. Excess tail mass dominates lower event sizes (<100)
5. Elite concentration grows logarithmically with agent count in both models
### Interpretation
The data suggests:
- DTI optimizes tail event management but becomes less effective at extreme scales
- Baseline model exhibits stronger scaling properties but accumulates more elite concentration
- Fixed-interval model's performance is context-dependent, excelling at mid-scale events
- The 24% excess in Baseline's max event size at N=32 indicates critical threshold behavior
- Elite concentration growth patterns suggest different resource distribution mechanisms between models
The charts collectively demonstrate trade-offs between tail risk management and scaling efficiency, with DTI prioritizing tail behavior at the cost of extreme-scale performance, while Baseline maintains better scalability at the expense of tail risk mitigation.