## Line Chart: NDCG@10/% vs. Dimensions for Different Methods
### Overview
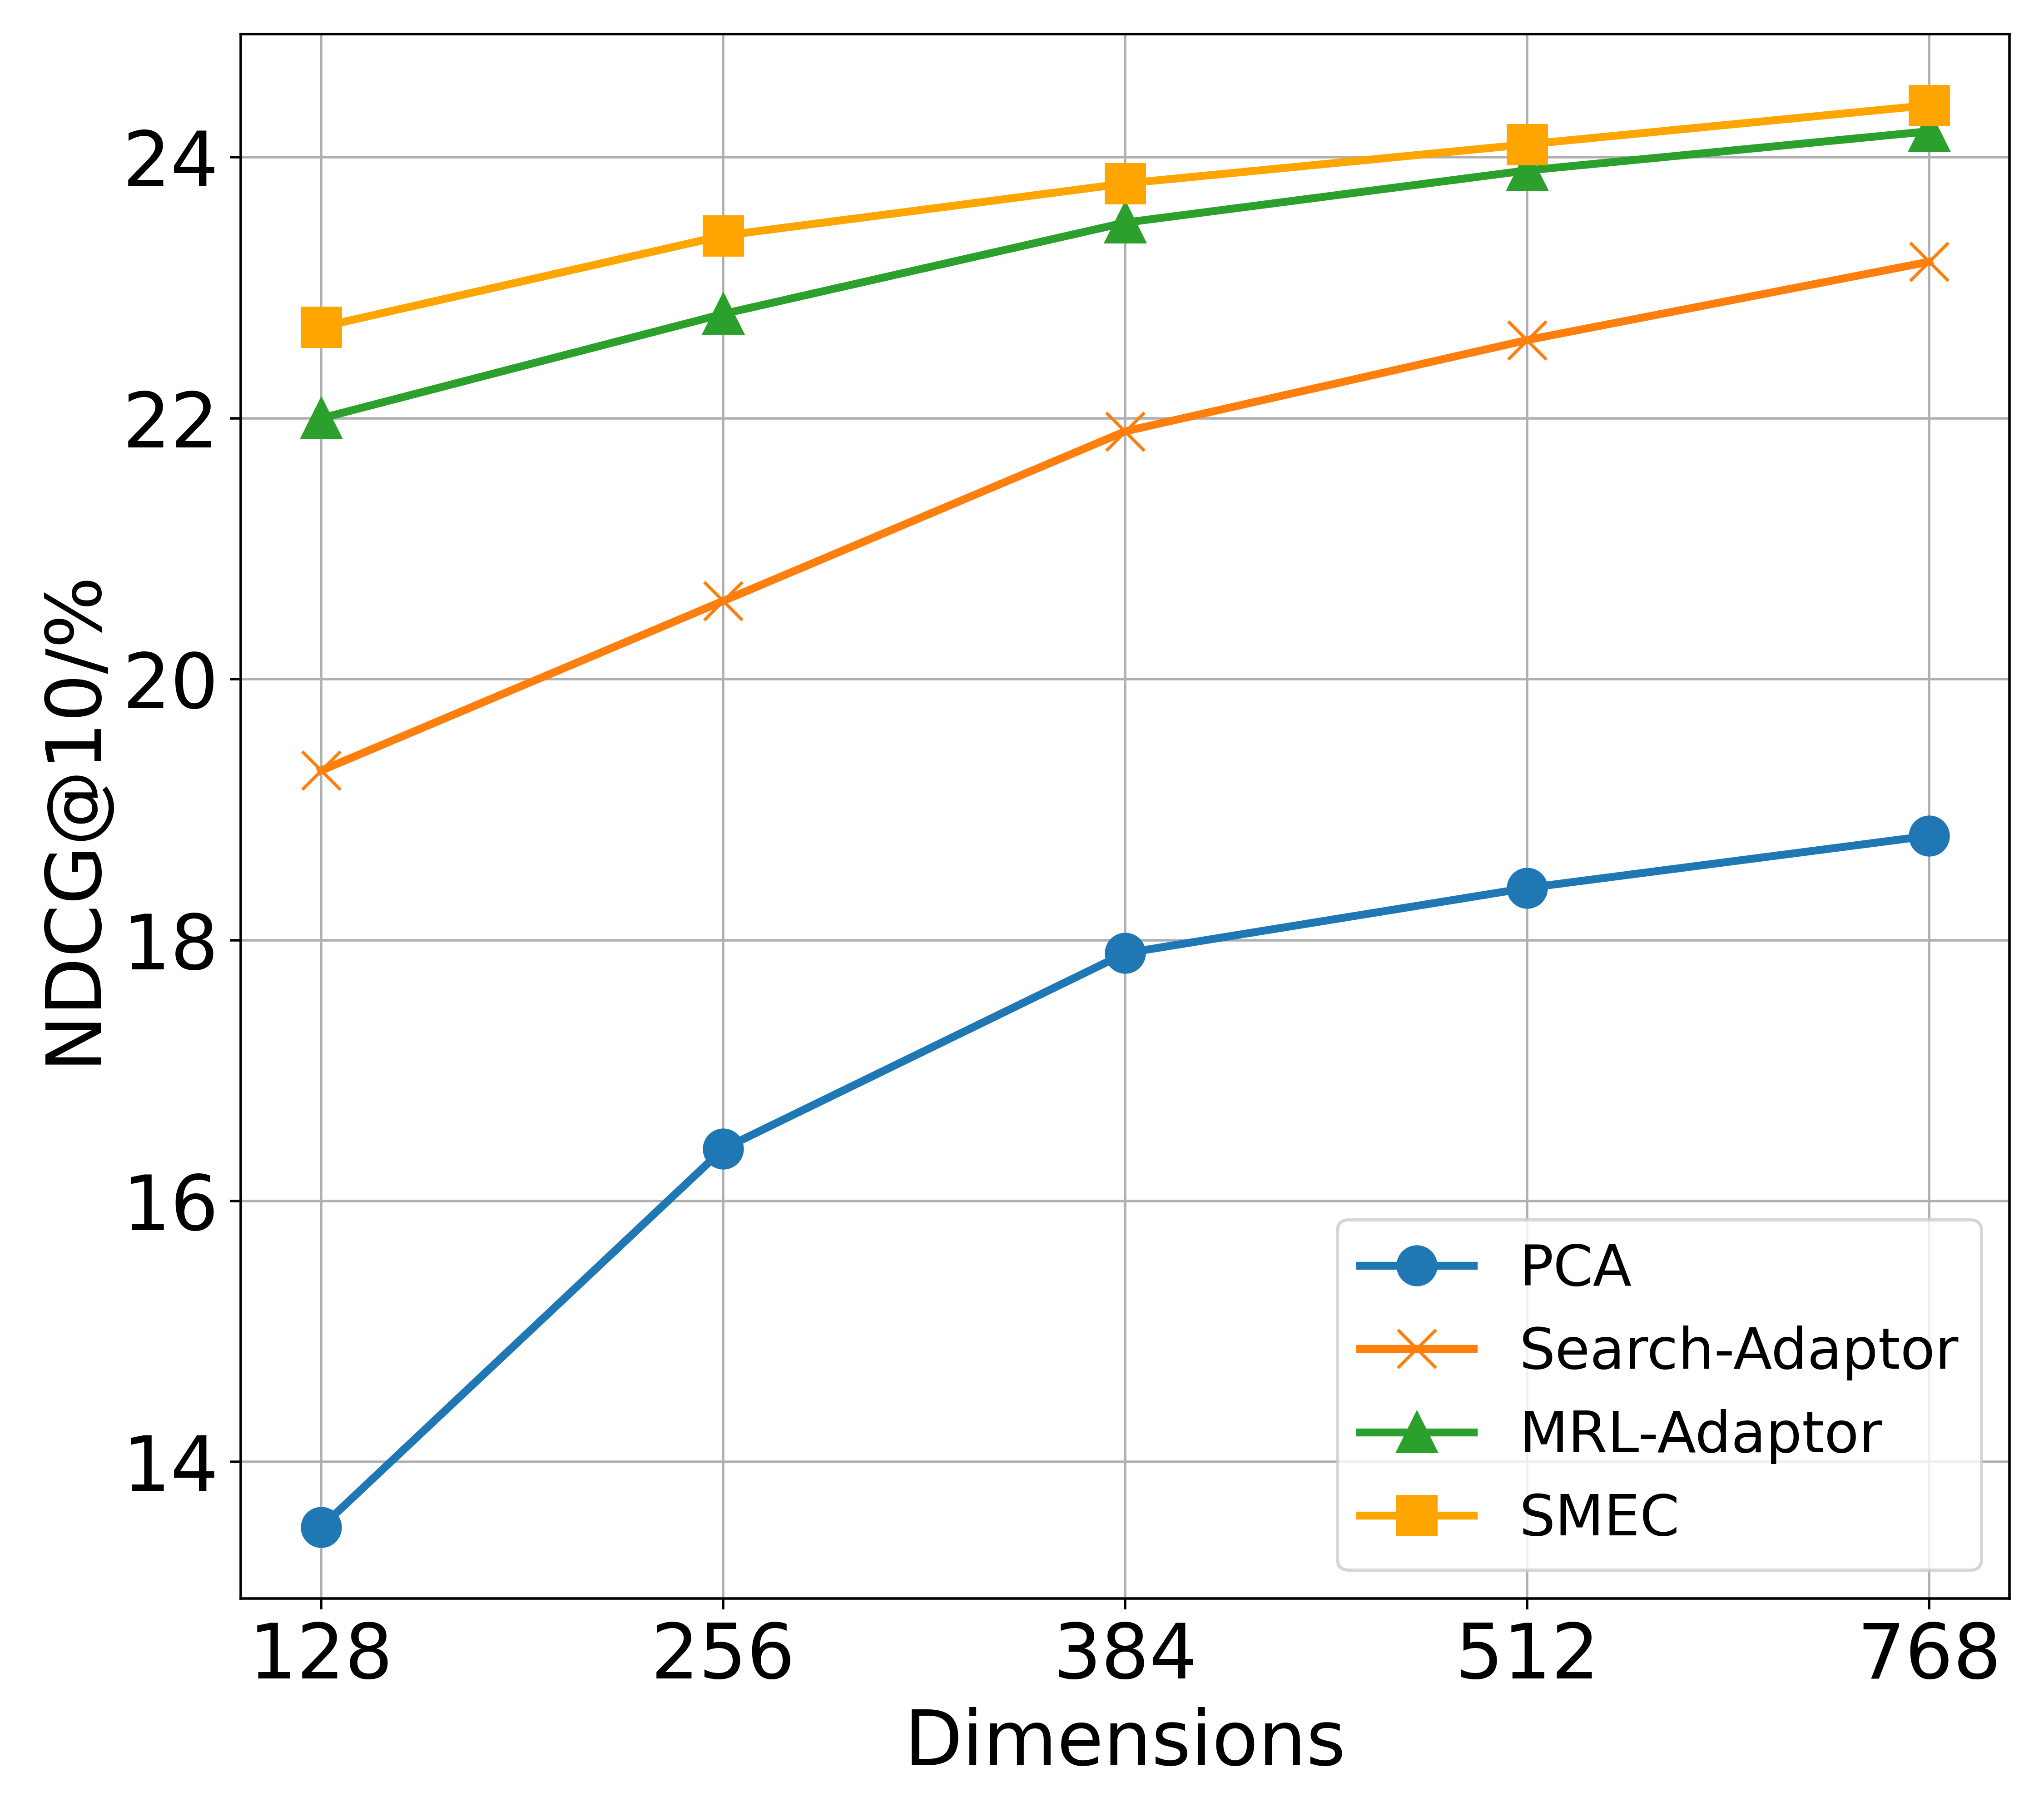
The image is a line chart comparing the performance of four different methods (PCA, Search-Adaptor, MRL-Adaptor, and SMEC) based on their NDCG@10/% scores across varying dimensions. The x-axis represents the number of dimensions, and the y-axis represents the NDCG@10/% score.
### Components/Axes
* **X-axis:** Dimensions, with markers at 128, 256, 384, 512, and 768.
* **Y-axis:** NDCG@10/%, with markers at 14, 16, 18, 20, 22, and 24.
* **Legend (bottom-right):**
* Blue line with circle marker: PCA
* Orange line with cross marker: Search-Adaptor
* Green line with triangle marker: MRL-Adaptor
* Yellow line with square marker: SMEC
### Detailed Analysis
* **PCA (Blue):** The PCA line starts at approximately 13.5 NDCG@10/% at 128 dimensions and increases to approximately 16.4 at 256 dimensions, 17.9 at 384 dimensions, 18.4 at 512 dimensions, and 18.8 at 768 dimensions. The trend is upward, but the rate of increase slows down as the number of dimensions increases.
* **Search-Adaptor (Orange):** The Search-Adaptor line starts at approximately 19.3 NDCG@10/% at 128 dimensions and increases to approximately 20.5 at 256 dimensions, 21.8 at 384 dimensions, 22.6 at 512 dimensions, and 23.1 at 768 dimensions. The trend is upward.
* **MRL-Adaptor (Green):** The MRL-Adaptor line starts at approximately 22.0 NDCG@10/% at 128 dimensions and increases to approximately 22.8 at 256 dimensions, 23.5 at 384 dimensions, 24.0 at 512 dimensions, and 24.2 at 768 dimensions. The trend is upward, with a slight flattening towards the higher dimensions.
* **SMEC (Yellow):** The SMEC line starts at approximately 22.6 NDCG@10/% at 128 dimensions and increases to approximately 23.8 at 384 dimensions, 24.1 at 512 dimensions, and 24.3 at 768 dimensions. The trend is upward, with a slight flattening towards the higher dimensions.
### Key Observations
* SMEC and MRL-Adaptor consistently outperform PCA and Search-Adaptor across all dimensions.
* PCA has the lowest NDCG@10/% scores across all dimensions.
* The performance of all methods generally improves as the number of dimensions increases, but the rate of improvement decreases at higher dimensions.
### Interpretation
The chart demonstrates the relationship between the number of dimensions and the NDCG@10/% score for different methods. SMEC and MRL-Adaptor appear to be the most effective methods for this particular task, as they consistently achieve higher NDCG@10/% scores compared to PCA and Search-Adaptor. The diminishing returns observed at higher dimensions suggest that there may be an optimal number of dimensions beyond which further increases do not significantly improve performance. PCA's relatively poor performance indicates that it may not be well-suited for this task or requires further optimization.