## Line Chart: NDCG@10% vs. Dimensions
### Overview
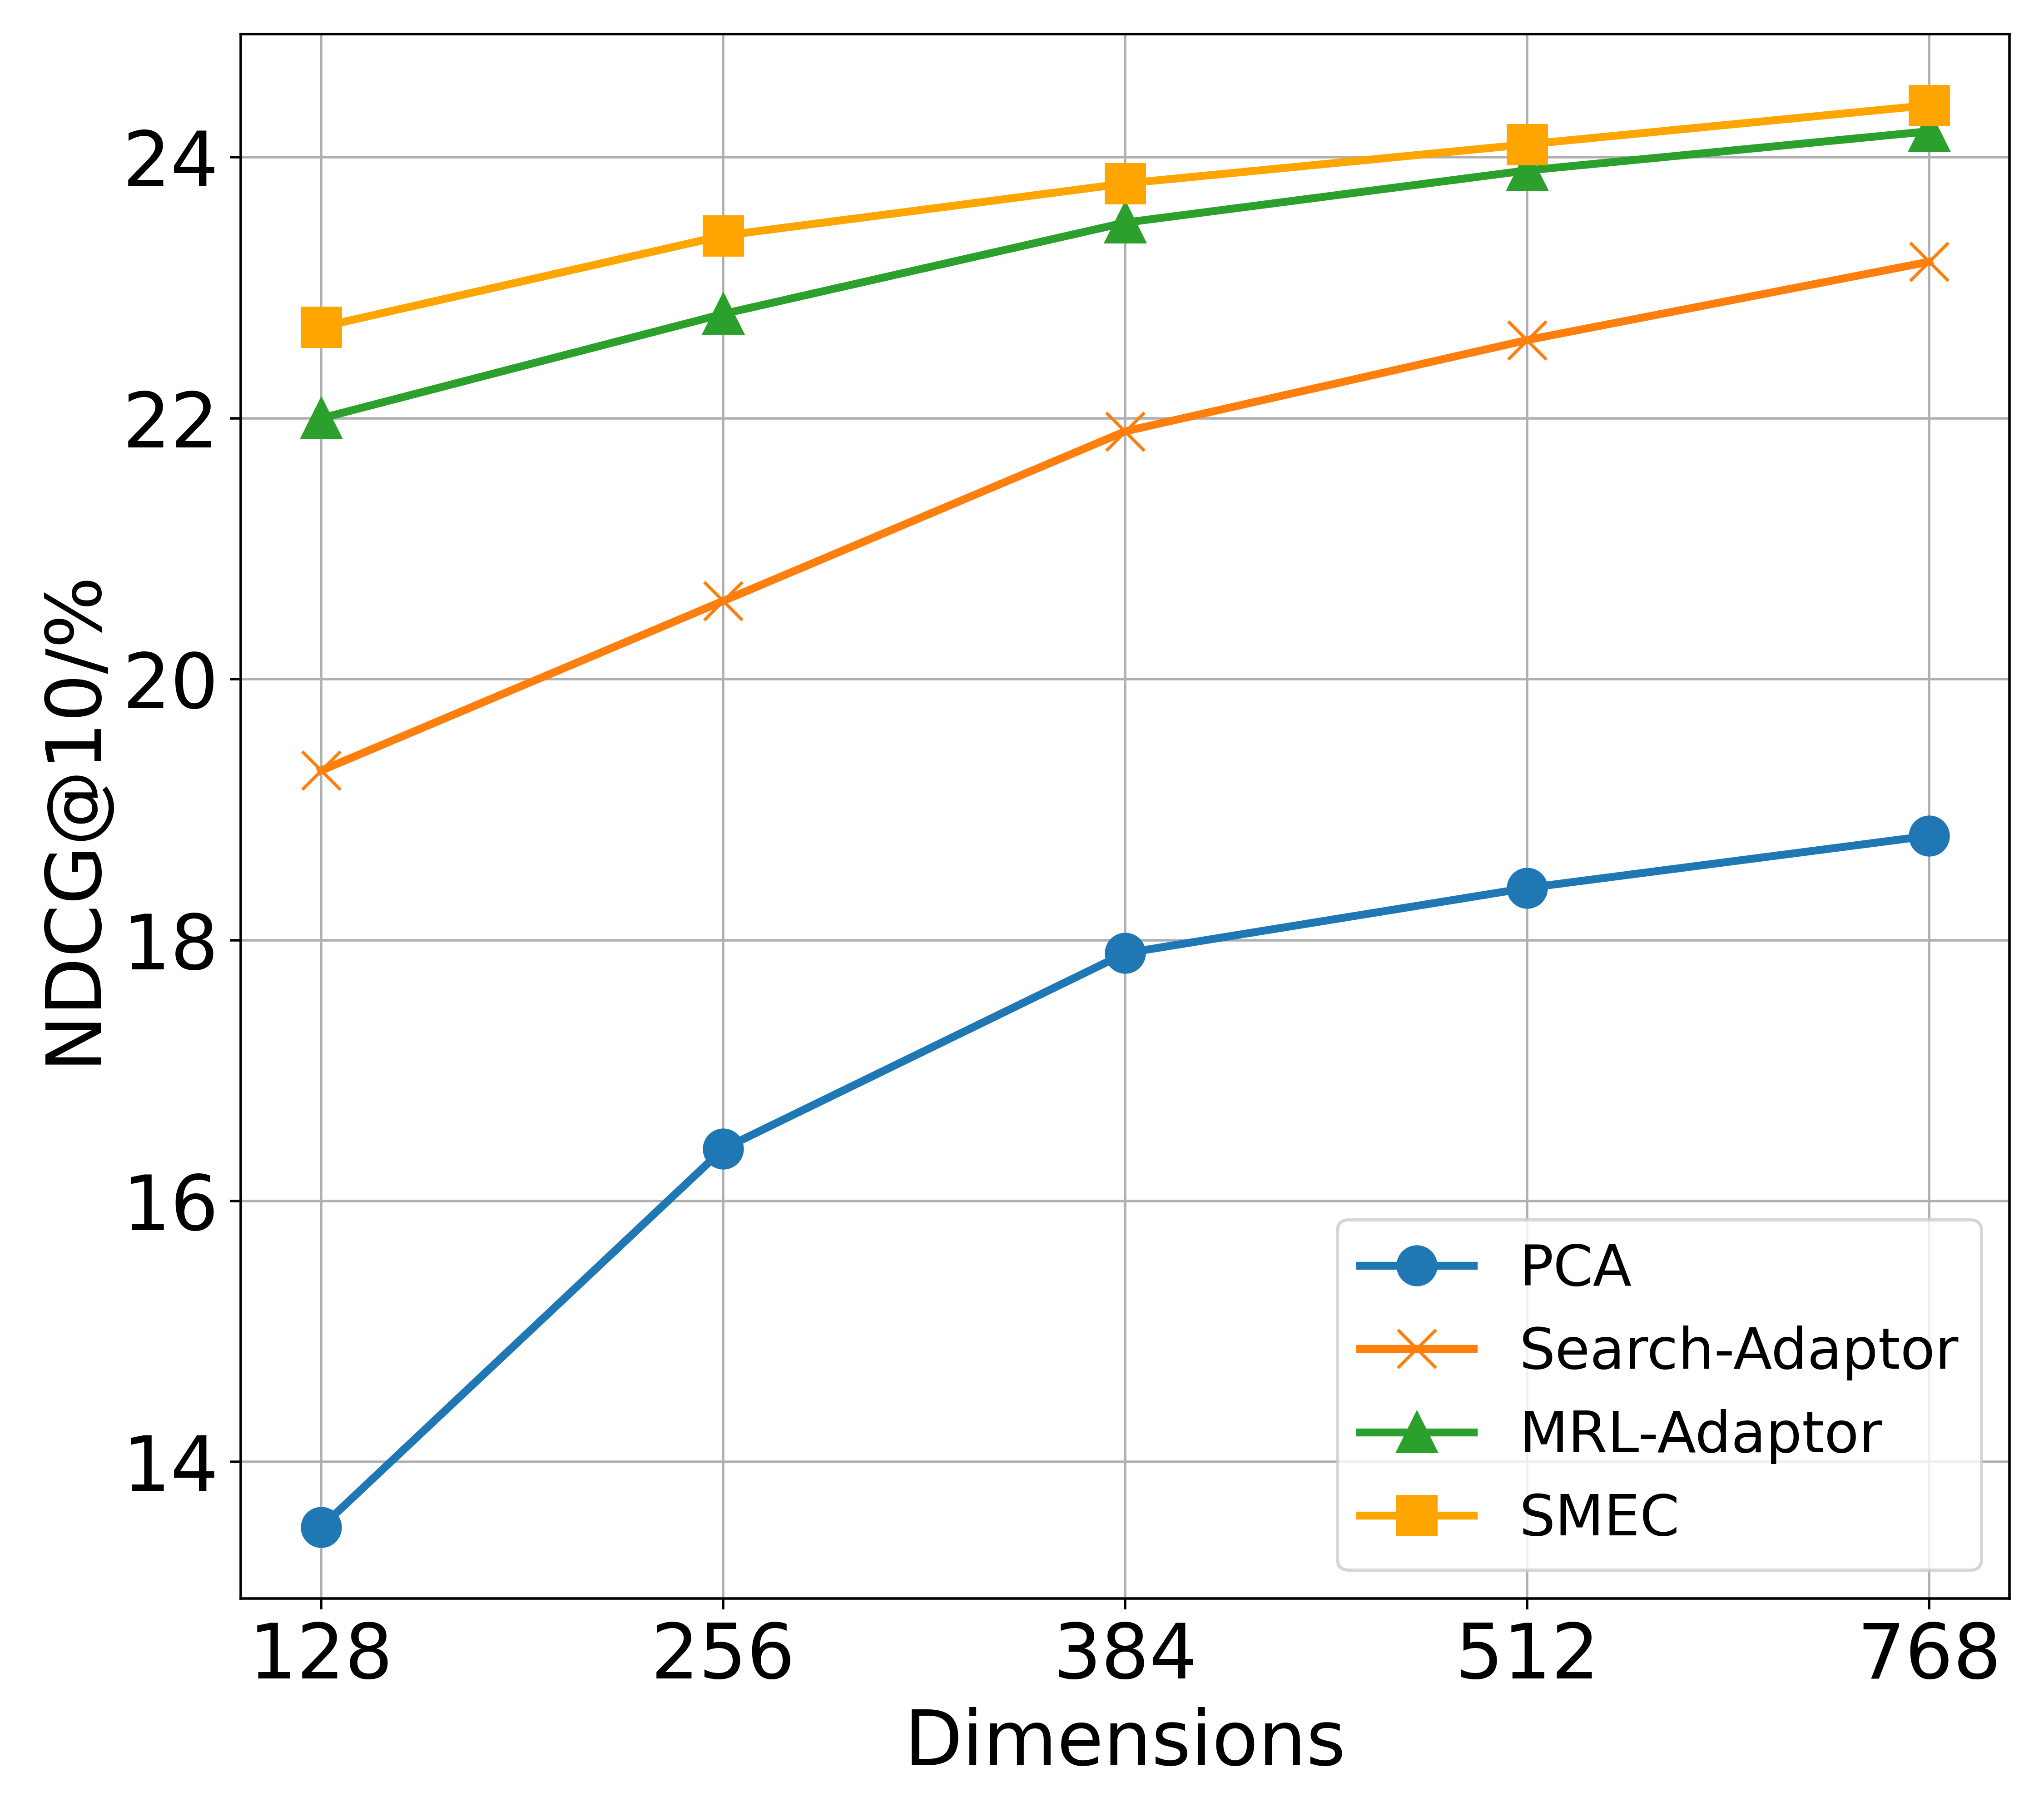
This line chart displays the relationship between the number of dimensions and the NDCG@10% metric for four different methods: PCA, Search-Adaptor, MRL-Adaptor, and SMEC. The x-axis represents the dimensions, ranging from 128 to 768, while the y-axis represents the NDCG@10% score, ranging from 14 to 24.
### Components/Axes
* **X-axis Title:** Dimensions
* **Y-axis Title:** NDCG@10%
* **X-axis Markers:** 128, 256, 384, 512, 768
* **Y-axis Markers:** 14, 16, 18, 20, 22, 24
* **Legend:** Located in the bottom-right corner.
* PCA (Blue Circle)
* Search-Adaptor (Orange Line)
* MRL-Adaptor (Green Triangle)
* SMEC (Yellow Square)
### Detailed Analysis
* **PCA (Blue Line):** The line slopes upward, indicating an increase in NDCG@10% as the number of dimensions increases.
* At 128 dimensions: Approximately 14.2
* At 256 dimensions: Approximately 16.2
* At 384 dimensions: Approximately 17.8
* At 512 dimensions: Approximately 18.5
* At 768 dimensions: Approximately 19.0
* **Search-Adaptor (Orange Line):** The line shows an initial steep increase, then plateaus.
* At 128 dimensions: Approximately 18.0
* At 256 dimensions: Approximately 20.2
* At 384 dimensions: Approximately 22.0
* At 512 dimensions: Approximately 22.5
* At 768 dimensions: Approximately 23.0
* **MRL-Adaptor (Green Line):** The line is relatively flat, with a slight upward trend.
* At 128 dimensions: Approximately 22.2
* At 256 dimensions: Approximately 23.0
* At 384 dimensions: Approximately 23.8
* At 512 dimensions: Approximately 24.0
* At 768 dimensions: Approximately 24.0
* **SMEC (Yellow Line):** The line shows a moderate upward trend, similar to Search-Adaptor but starting at a higher value.
* At 128 dimensions: Approximately 22.5
* At 256 dimensions: Approximately 23.2
* At 384 dimensions: Approximately 23.8
* At 512 dimensions: Approximately 24.0
* At 768 dimensions: Approximately 24.0
### Key Observations
* PCA shows the most significant improvement in NDCG@10% with increasing dimensions, but starts from the lowest value.
* MRL-Adaptor and SMEC consistently achieve the highest NDCG@10% scores across all dimensions.
* Search-Adaptor shows a rapid initial improvement, but its performance plateaus at higher dimensions.
* The performance gap between PCA and the other methods widens as the number of dimensions increases.
### Interpretation
The chart demonstrates the impact of dimensionality on the performance of different methods for a retrieval or ranking task, as measured by NDCG@10%. The NDCG@10% metric indicates the ranking quality of the top 10 results.
The fact that PCA's performance improves with dimensionality suggests that it benefits from having more features to represent the data. However, the other methods (Search-Adaptor, MRL-Adaptor, and SMEC) achieve higher scores even at lower dimensions, indicating that they are more efficient at capturing relevant information. The plateauing of Search-Adaptor suggests that beyond a certain point, adding more dimensions does not significantly improve its performance.
The consistently high performance of MRL-Adaptor and SMEC suggests that they are robust methods that are less sensitive to the number of dimensions. This could be due to their ability to effectively learn and adapt to the data, or to their use of more sophisticated techniques for dimensionality reduction or feature selection.
The chart highlights the importance of choosing an appropriate method and dimensionality for a given task. While increasing the number of dimensions can improve performance for some methods, it is not always necessary or beneficial.