## Bar Charts: Throughput and Packet Delays
### Overview
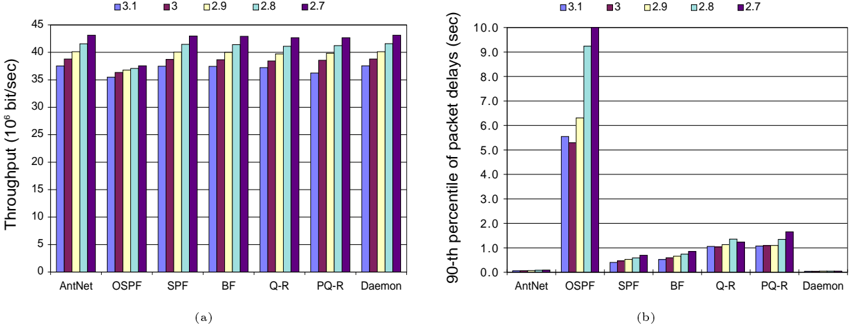
The image presents two bar charts comparing the performance of different network protocols (AntNet, OSPF, SPF, BF, Q-R, PQ-R, and Daemon) under varying conditions (3.1, 3, 2.9, 2.8, and 2.7). The left chart displays throughput in 10^6 bits/sec, while the right chart shows the 90th percentile of packet delays in seconds.
### Components/Axes
**Left Chart (Throughput):**
* **Title:** Throughput (10^6 bit/sec)
* **X-axis:** Network Protocols (AntNet, OSPF, SPF, BF, Q-R, PQ-R, Daemon)
* **Y-axis:** Throughput (10^6 bit/sec), ranging from 0 to 45 in increments of 5.
* **Legend (Top):**
* Blue: 3.1
* Maroon: 3
* Yellow: 2.9
* Light Blue: 2.8
* Purple: 2.7
**Right Chart (Packet Delays):**
* **Title:** 90-th percentile of packet delays (sec)
* **X-axis:** Network Protocols (AntNet, OSPF, SPF, BF, Q-R, PQ-R, Daemon)
* **Y-axis:** 90-th percentile of packet delays (sec), ranging from 0.0 to 10.0 in increments of 1.0.
* **Legend (Top):**
* Blue: 3.1
* Maroon: 3
* Yellow: 2.9
* Light Blue: 2.8
* Purple: 2.7
### Detailed Analysis
**Left Chart (Throughput):**
* **AntNet:** Throughput values are approximately: 3.1 (37), 3 (37), 2.9 (38), 2.8 (36), 2.7 (37).
* **OSPF:** Throughput values are approximately: 3.1 (37), 3 (37), 2.9 (39), 2.8 (37), 2.7 (38).
* **SPF:** Throughput values are approximately: 3.1 (42), 3 (41), 2.9 (42), 2.8 (41), 2.7 (42).
* **BF:** Throughput values are approximately: 3.1 (42), 3 (41), 2.9 (42), 2.8 (41), 2.7 (42).
* **Q-R:** Throughput values are approximately: 3.1 (42), 3 (41), 2.9 (42), 2.8 (41), 2.7 (42).
* **PQ-R:** Throughput values are approximately: 3.1 (42), 3 (41), 2.9 (42), 2.8 (41), 2.7 (43).
* **Daemon:** Throughput values are approximately: 3.1 (43), 3 (42), 2.9 (43), 2.8 (42), 2.7 (43).
**Trend:** The throughput is relatively consistent across all protocols and conditions, with Daemon showing slightly higher throughput.
**Right Chart (Packet Delays):**
* **AntNet:** Packet delay values are approximately: 3.1 (0.1), 3 (0.1), 2.9 (0.1), 2.8 (0.1), 2.7 (0.1).
* **OSPF:** Packet delay values are approximately: 3.1 (5.5), 3 (10), 2.9 (6.2), 2.8 (5.3), 2.7 (5.5).
* **SPF:** Packet delay values are approximately: 3.1 (0.4), 3 (0.4), 2.9 (0.5), 2.8 (0.4), 2.7 (0.4).
* **BF:** Packet delay values are approximately: 3.1 (0.6), 3 (0.7), 2.9 (0.7), 2.8 (0.6), 2.7 (0.7).
* **Q-R:** Packet delay values are approximately: 3.1 (1.0), 3 (1.1), 2.9 (1.1), 2.8 (1.0), 2.7 (1.1).
* **PQ-R:** Packet delay values are approximately: 3.1 (1.1), 3 (1.6), 2.9 (1.4), 2.8 (1.1), 2.7 (1.7).
* **Daemon:** Packet delay values are approximately: 3.1 (0.1), 3 (0.1), 2.9 (0.1), 2.8 (0.1), 2.7 (0.1).
**Trend:** OSPF exhibits significantly higher packet delays compared to other protocols. AntNet and Daemon have the lowest packet delays.
### Key Observations
* Throughput is relatively consistent across different protocols and conditions.
* OSPF has significantly higher packet delays compared to other protocols.
* AntNet and Daemon show the lowest packet delays.
### Interpretation
The data suggests that while most protocols maintain similar throughput levels, OSPF introduces a substantial delay in packet delivery. This could be due to the routing algorithms or overhead associated with OSPF. AntNet and Daemon appear to be the most efficient in terms of packet delay, indicating their suitability for applications where low latency is critical. The varying conditions (3.1, 3, 2.9, 2.8, 2.7) do not seem to have a significant impact on throughput, but they do influence packet delays, particularly for OSPF. The charts highlight the trade-offs between different network protocols, where some prioritize throughput while others focus on minimizing packet delays.