\n
## Bar Chart: Throughput and 90th Percentile Packet Delays
### Overview
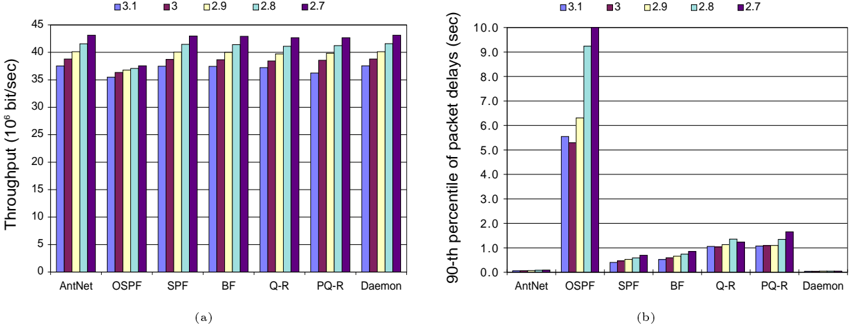
The image presents two bar charts side-by-side. The left chart (a) displays throughput (in 10^6 bits/sec) for different network configurations under varying congestion control algorithms. The right chart (b) shows the 90th percentile of packet delays (in seconds) for the same network configurations and algorithms. Both charts compare the performance of algorithms 3.1, 3, 2.9, and 2.7.
### Components/Axes
**Chart (a) - Throughput:**
* **X-axis:** Network Configurations: AntNet, OSPF, SPF, BF, Q-R, PQ-R, Daemon.
* **Y-axis:** Throughput (10^6 bit/sec), ranging from 0 to 45.
* **Legend:**
* 3.1 (Dark Blue)
* 3 (Light Blue)
* 2.9 (Green)
* 2.7 (Purple)
**Chart (b) - Packet Delays:**
* **X-axis:** Network Configurations: AntNet, OSPF, SPF, BF, Q-R, PQ-R, Daemon.
* **Y-axis:** 90th percentile of packet delays (sec), ranging from 0 to 10.
* **Legend:**
* 3.1 (Dark Blue)
* 3 (Light Blue)
* 2.9 (Green)
* 2.7 (Purple)
### Detailed Analysis or Content Details
**Chart (a) - Throughput:**
* **AntNet:**
* 3.1: Approximately 41.5 (±0.5)
* 3: Approximately 40.5 (±0.5)
* 2.9: Approximately 40.0 (±0.5)
* 2.7: Approximately 39.5 (±0.5)
* **OSPF:**
* 3.1: Approximately 38.0 (±0.5)
* 3: Approximately 36.0 (±0.5)
* 2.9: Approximately 35.0 (±0.5)
* 2.7: Approximately 34.0 (±0.5)
* **SPF:**
* 3.1: Approximately 42.0 (±0.5)
* 3: Approximately 40.0 (±0.5)
* 2.9: Approximately 39.0 (±0.5)
* 2.7: Approximately 38.0 (±0.5)
* **BF:**
* 3.1: Approximately 42.5 (±0.5)
* 3: Approximately 41.0 (±0.5)
* 2.9: Approximately 40.0 (±0.5)
* 2.7: Approximately 39.0 (±0.5)
* **Q-R:**
* 3.1: Approximately 39.0 (±0.5)
* 3: Approximately 37.0 (±0.5)
* 2.9: Approximately 36.0 (±0.5)
* 2.7: Approximately 35.0 (±0.5)
* **PQ-R:**
* 3.1: Approximately 40.0 (±0.5)
* 3: Approximately 38.0 (±0.5)
* 2.9: Approximately 37.0 (±0.5)
* 2.7: Approximately 36.0 (±0.5)
* **Daemon:**
* 3.1: Approximately 43.0 (±0.5)
* 3: Approximately 41.5 (±0.5)
* 2.9: Approximately 40.5 (±0.5)
* 2.7: Approximately 39.5 (±0.5)
**Chart (b) - Packet Delays:**
* **AntNet:**
* 3.1: Approximately 0.6 (±0.1)
* 3: Approximately 0.5 (±0.1)
* 2.9: Approximately 0.4 (±0.1)
* 2.7: Approximately 0.3 (±0.1)
* **OSPF:**
* 3.1: Approximately 5.5 (±0.5)
* 3: Approximately 5.0 (±0.5)
* 2.9: Approximately 4.5 (±0.5)
* 2.7: Approximately 4.0 (±0.5)
* **SPF:**
* 3.1: Approximately 9.5 (±0.5)
* 3: Approximately 9.0 (±0.5)
* 2.9: Approximately 8.5 (±0.5)
* 2.7: Approximately 8.0 (±0.5)
* **BF:**
* 3.1: Approximately 0.5 (±0.1)
* 3: Approximately 0.4 (±0.1)
* 2.9: Approximately 0.3 (±0.1)
* 2.7: Approximately 0.2 (±0.1)
* **Q-R:**
* 3.1: Approximately 1.0 (±0.1)
* 3: Approximately 0.9 (±0.1)
* 2.9: Approximately 0.8 (±0.1)
* 2.7: Approximately 0.7 (±0.1)
* **PQ-R:**
* 3.1: Approximately 1.2 (±0.1)
* 3: Approximately 1.1 (±0.1)
* 2.9: Approximately 1.0 (±0.1)
* 2.7: Approximately 0.9 (±0.1)
* **Daemon:**
* 3.1: Approximately 1.5 (±0.1)
* 3: Approximately 1.4 (±0.1)
* 2.9: Approximately 1.3 (±0.1)
* 2.7: Approximately 1.2 (±0.1)
### Key Observations
* In the throughput chart, Daemon consistently exhibits the highest throughput across all algorithms.
* Throughput generally decreases as the algorithm version number decreases (3.1 > 3 > 2.9 > 2.7).
* In the packet delay chart, SPF has the highest delays, while AntNet and BF have the lowest.
* Packet delays also generally decrease with lower algorithm version numbers.
* There is an inverse relationship between throughput and packet delay: configurations with higher throughput tend to have higher packet delays, and vice versa.
### Interpretation
The data suggests that the Daemon algorithm provides the best throughput performance, but at the cost of increased packet delays. Conversely, AntNet and BF offer the lowest packet delays but have lower throughput. The algorithm version (3.1, 3, 2.9, 2.7) appears to influence both throughput and delay, with newer versions generally performing better in terms of throughput but potentially increasing delays.
The relationship between throughput and delay indicates a trade-off. Optimizing for one metric may negatively impact the other. The choice of algorithm and version should therefore depend on the specific network requirements and priorities. For example, if low latency is critical, AntNet or BF might be preferred, while if maximizing throughput is the goal, Daemon could be a better choice.
The consistent trends across different network configurations suggest that these observations are not specific to any particular topology but rather reflect inherent characteristics of the algorithms themselves. The data provides valuable insights for network designers and administrators seeking to optimize network performance.