## Bar Charts: Network Protocol Performance Comparison
### Overview
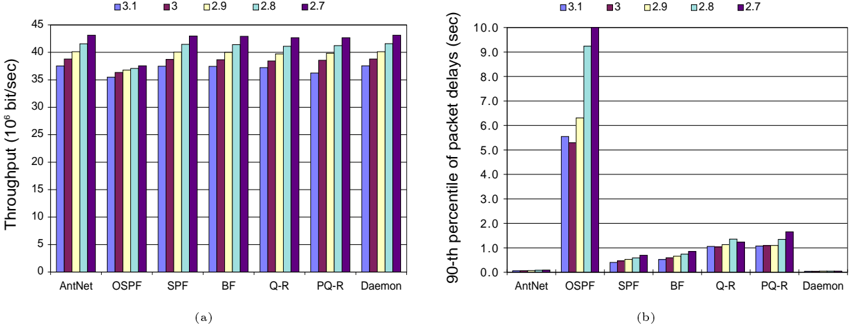
The image displays two side-by-side bar charts, labeled (a) and (b), comparing the performance of seven different network routing protocols or algorithms across five distinct configurations or versions (labeled 3.1, 3, 2.9, 2.8, 2.7). Chart (a) measures throughput, while chart (b) measures packet delay. The overall visual suggests a performance trade-off analysis.
### Components/Axes
**Common Elements:**
* **Legend:** Positioned at the top center of each chart. It defines five data series by color:
* **3.1:** Light blue
* **3:** Dark red/maroon
* **2.9:** Light yellow/cream
* **2.8:** Light green
* **2.7:** Dark purple
* **X-Axis (Both Charts):** Lists seven network protocols/algorithms. From left to right: `AntNet`, `OSPF`, `SPF`, `BF`, `Q-R`, `PQ-R`, `Daemon`.
* **Chart Labels:** The charts are labeled `(a)` and `(b)` in the bottom-left corner of each respective plot area.
**Chart (a) Specifics:**
* **Title/Y-Axis Label:** `Throughput (10^6 bit/sec)`
* **Y-Axis Scale:** Linear scale from 0 to 45, with major gridlines at intervals of 5.
**Chart (b) Specifics:**
* **Title/Y-Axis Label:** `90-th percentile of packet delays (sec)`
* **Y-Axis Scale:** Linear scale from 0.0 to 10.0, with major gridlines at intervals of 1.0.
### Detailed Analysis
**Chart (a): Throughput Analysis**
* **Trend Verification:** For nearly all protocols, throughput shows a consistent upward trend from configuration `3.1` to `2.7`. The bars get progressively taller from left (light blue) to right (dark purple) within each protocol group.
* **Data Points (Approximate Values in 10^6 bit/sec):**
* **AntNet:** 3.1≈37, 3≈39, 2.9≈41, 2.8≈42, 2.7≈43
* **OSPF:** 3.1≈35, 3≈36, 2.9≈37, 2.8≈37, 2.7≈37
* **SPF:** 3.1≈37, 3≈39, 2.9≈41, 2.8≈42, 2.7≈43
* **BF:** 3.1≈37, 3≈39, 2.9≈41, 2.8≈42, 2.7≈43
* **Q-R:** 3.1≈37, 3≈39, 2.9≈41, 2.8≈42, 2.7≈43
* **PQ-R:** 3.1≈36, 3≈38, 2.9≈40, 2.8≈41, 2.7≈42
* **Daemon:** 3.1≈38, 3≈40, 2.9≈42, 2.8≈43, 2.7≈44
* **Key Observation:** `Daemon` achieves the highest throughput across all configurations, peaking at ~44. `OSPF` shows the least improvement across configurations and has the lowest throughput for most, except for `3.1` where it is comparable to others.
**Chart (b): 90th Percentile Packet Delay Analysis**
* **Trend Verification:** The trend is highly protocol-dependent. `OSPF` shows a dramatic, non-linear increase in delay from `3.1` to `2.7`. All other protocols show a very slight, gradual increase.
* **Data Points (Approximate Values in seconds):**
* **AntNet:** All values are very low, < 0.2 sec.
* **OSPF:** 3.1≈5.6, 3≈5.3, 2.9≈6.3, 2.8≈9.2, 2.7≈10.0
* **SPF:** 3.1≈0.4, 3≈0.5, 2.9≈0.6, 2.8≈0.7, 2.7≈0.8
* **BF:** 3.1≈0.5, 3≈0.6, 2.9≈0.7, 2.8≈0.8, 2.7≈0.9
* **Q-R:** 3.1≈1.0, 3≈1.1, 2.9≈1.2, 2.8≈1.3, 2.7≈1.4
* **PQ-R:** 3.1≈1.1, 3≈1.2, 2.9≈1.3, 2.8≈1.4, 2.7≈1.7
* **Daemon:** All values are extremely low, near 0.0 sec.
* **Key Observation:** `OSPF` is a massive outlier, with delays 5-100 times higher than other protocols, especially in configurations `2.8` and `2.7`. `Daemon` and `AntNet` exhibit the best (lowest) delay performance.
### Interpretation
The data demonstrates a clear performance dichotomy between the `OSPF` protocol and the others tested.
1. **Performance Trade-off:** `OSPF` appears to be optimized for a different metric not shown here (perhaps stability or simplicity), as it suffers from significantly higher latency (chart b) while also delivering the lowest throughput (chart a) in most configurations. The other protocols (`AntNet`, `SPF`, `BF`, `Q-R`, `PQ-R`, `Daemon`) form a cluster with high throughput and low delay.
2. **Configuration Impact:** The configuration parameter (3.1 to 2.7) has a predictable, positive effect on throughput for all protocols. However, its effect on delay is protocol-specific. For `OSPF`, moving to configurations `2.8` and `2.7` causes a catastrophic increase in delay, suggesting these configurations may introduce complexity or overhead that `OSPF` handles poorly. For other protocols, the same configuration changes cause only a minor, linear increase in delay.
3. **Top Performer:** The `Daemon` protocol consistently shows the best combined performance: the highest throughput and the lowest packet delay across all configurations. `AntNet` is a close second in delay performance.
4. **Anomaly:** The `OSPF` delay for configuration `3` (≈5.3s) is slightly lower than for `3.1` (≈5.6s), breaking the otherwise strict increasing trend. This could be a measurement artifact or indicate a non-monotonic relationship for this specific protocol.
**Conclusion:** The charts strongly suggest that for the measured workloads, protocols like `Daemon` and `AntNet` are superior to `OSPF` in both throughput and latency. The choice of configuration (3.1-2.7) involves a trade-off: higher-numbered configurations (e.g., 2.7) maximize throughput but may incur a small latency penalty for most protocols, and a severe one for `OSPF`.