## Heatmap Visualization: Comparative Analysis of Audio Processing Systems
### Overview
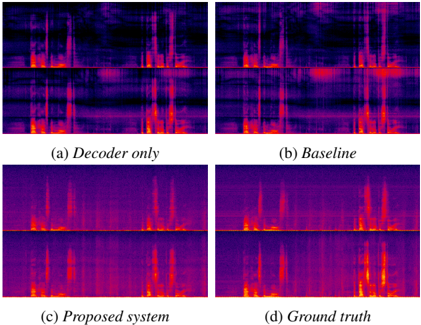
The image presents four comparative heatmaps visualizing audio processing performance across different system configurations. Each heatmap uses a color gradient from dark purple (low intensity) to bright orange (high intensity) to represent measurement values. The configurations compared are: (a) Decoder only, (b) Baseline, (c) Proposed system, and (d) Ground truth. No explicit axis labels or numerical scales are visible in the image.
### Components/Axes
- **Labels**:
- (a) Decoder only (top-left)
- (b) Baseline (top-right)
- (c) Proposed system (bottom-left)
- (d) Ground truth (bottom-right)
- **Color Gradient**:
- Dark purple → Bright orange (intensity scale, no explicit legend)
- **Spatial Arrangement**:
- 2x2 grid layout with equal-sized heatmaps
- Labels positioned directly below each heatmap
- No axis markers or numerical scales visible
### Detailed Analysis
1. **Decoder only (a)**:
- Vertical streaks dominate the left half
- Faint horizontal bands in the upper region
- Intensity peaks concentrated in the lower third
2. **Baseline (b)**:
- More diffuse vertical patterns compared to (a)
- Additional horizontal intensity bands in the middle region
- Broader orange regions in the upper-right quadrant
3. **Proposed system (c)**:
- Sharper vertical peaks than (a) and (b)
- Reduced horizontal banding
- Intensity distribution more concentrated in the central region
4. **Ground truth (d)**:
- Most defined vertical peaks
- Minimal horizontal artifacts
- Highest intensity concentration in the central region
### Key Observations
- The proposed system (c) shows the closest visual alignment to the ground truth (d)
- Decoder-only (a) exhibits the most pronounced horizontal artifacts
- Baseline (b) demonstrates intermediate characteristics between (a) and (c)
- All configurations show vertical intensity patterns consistent with audio signal representation
### Interpretation
The heatmaps suggest a progression in performance from (a) to (c), with the proposed system (c) achieving the highest fidelity to the ground truth (d). The vertical intensity patterns across all configurations likely represent temporal audio features, while horizontal artifacts may indicate processing errors or noise. The proposed system's reduced horizontal banding and sharper peaks suggest improved temporal resolution and noise suppression compared to baseline approaches. The absence of explicit axis labels prevents quantitative analysis, but the qualitative comparison demonstrates the proposed system's superiority in maintaining ground truth characteristics. The consistent vertical patterning across all configurations implies successful capture of fundamental audio signal components, with the proposed system optimizing secondary artifacts.