# Technical Document Extraction: Freq. of Pattern Categories per Turn
## 1. Document Metadata
* **Title:** Freq. of Pattern Categories per Turn
* **Type:** Stacked Bar Chart
* **Primary Language:** English
* **X-Axis Label:** Turns (Categorical ranges)
* **Y-Axis Label:** Frequency (Numerical, 0 to 200+)
## 2. Component Isolation
### Header
* **Text:** "Freq. of Pattern Categories per Turn"
### Main Chart Area
* **X-Axis Categories (Turns):** 1-3, 2-4, 3-5, 4-6, 5-7, 6-8, 7-9, 8-10, 9-11, 10-12, 11-13, 12-14.
* **Y-Axis Markers:** 0, 50, 100, 150, 200.
* **Data Series:** Five stacked categories represented by specific colors.
### Legend (Spatial Grounding: Top Right [x~0.8, y~0.2])
* **Light Orange:** Localization (Line)
* **Dark Red:** Localization (File)
* **Dark Green:** Editing
* **Bright Green:** Reproduction
* **Grey:** Submission
---
## 3. Data Extraction and Trend Analysis
### Trend Verification
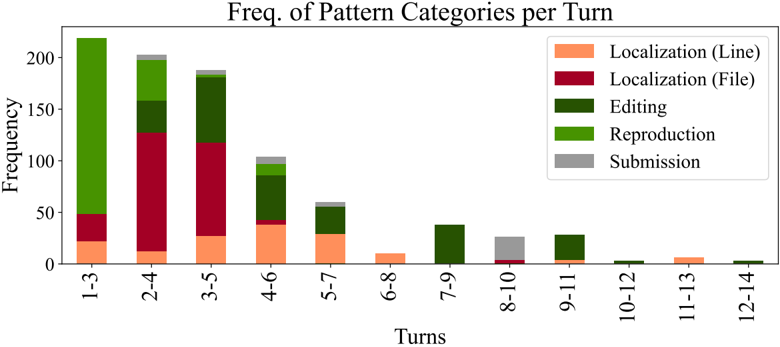
* **Overall Trend:** The total frequency of all categories combined shows a sharp downward trend as the number of "Turns" increases. The highest activity occurs in the 1-3 turn range (~220 units) and tapers off to near zero by the 12-14 turn range.
* **Reproduction (Bright Green):** Dominant in the earliest turns (1-3), then rapidly decreases and disappears after the 4-6 turn range.
* **Localization (File) (Dark Red):** Peaks in the 2-4 and 3-5 turn ranges, then diminishes significantly.
* **Editing (Dark Green):** Maintains a relatively consistent presence in the middle ranges (3-5 through 5-7) and is the primary activity seen in later turns (7-9, 9-11).
* **Submission (Grey):** Appears sporadically as a small "cap" on the bars, notably in ranges 2-4, 3-5, 4-6, 5-7, and 8-10.
### Data Table (Estimated Values)
The following table reconstructs the visual data points from the stacked bars. Values are approximated based on the Y-axis scale.
| Turns | Localization (Line) [Orange] | Localization (File) [Red] | Editing [Dk Green] | Reproduction [Lt Green] | Submission [Grey] | Total (Approx) |
| :--- | :---: | :---: | :---: | :---: | :---: | :---: |
| **1-3** | 22 | 26 | 0 | 172 | 0 | 220 |
| **2-4** | 12 | 115 | 32 | 38 | 5 | 202 |
| **3-5** | 27 | 90 | 65 | 3 | 3 | 188 |
| **4-6** | 38 | 5 | 43 | 11 | 7 | 104 |
| **5-7** | 29 | 0 | 26 | 0 | 5 | 60 |
| **6-8** | 10 | 0 | 0 | 0 | 0 | 10 |
| **7-9** | 0 | 0 | 38 | 0 | 0 | 38 |
| **8-10** | 0 | 4 | 0 | 0 | 22 | 26 |
| **9-11** | 4 | 0 | 24 | 0 | 0 | 28 |
| **10-12** | 0 | 0 | 3 | 0 | 0 | 3 |
| **11-13** | 6 | 0 | 0 | 0 | 0 | 6 |
| **12-14** | 0 | 0 | 3 | 0 | 0 | 3 |
---
## 4. Summary of Findings
The chart illustrates the lifecycle of a process across "Turns."
1. **Initial Phase (Turns 1-3):** Heavily dominated by **Reproduction**.
2. **Middle Phase (Turns 2-5):** Shift toward **Localization (File)** and the beginning of **Editing**.
3. **Late Phase (Turns 7+):** Activity drops significantly, with **Editing** and occasional **Submission** or **Localization (Line)** being the only remaining patterns.
4. **Submission** activity is most prominent as a concluding action in the 8-10 turn range, despite the overall lower frequency in that bracket.