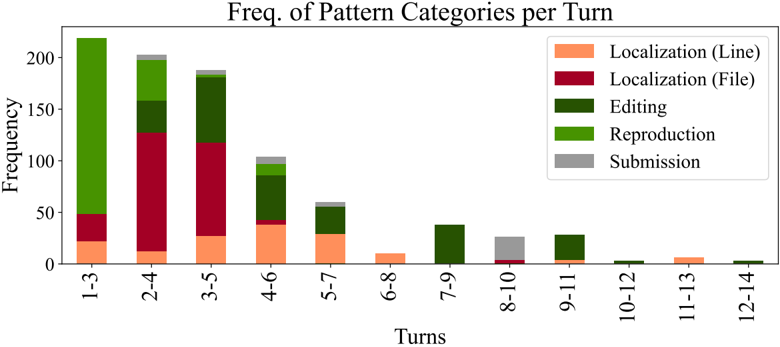
## Bar Chart: Frequency of Pattern Categories per Turn
### Overview
The chart displays the frequency distribution of five pattern categories across 12 turn ranges (1-3 to 12-14). Each turn range is represented by a stacked bar, with segments colored according to the legend. The y-axis measures frequency (0-200), and the x-axis groups turns in ranges of 2 (e.g., 1-3, 2-4).
### Components/Axes
- **X-axis (Turns)**: Labeled "Turns" with ranges: 1-3, 2-4, 3-5, 4-6, 5-7, 6-8, 7-9, 8-10, 9-11, 10-12, 11-13, 12-14.
- **Y-axis (Frequency)**: Labeled "Frequency" with increments of 50 up to 200.
- **Legend**: Positioned on the right, with five categories:
- **Localization (Line)**: Orange
- **Localization (File)**: Red
- **Editing**: Dark green
- **Reproduction**: Bright green
- **Submission**: Gray
### Detailed Analysis
- **Turn 1-3**:
- Total frequency ~220 (highest overall).
- Dominated by **Editing** (~100, bright green).
- **Localization (File)** (~30, red) and **Reproduction** (~50, dark green) contribute significantly.
- **Localization (Line)** (~20, orange) and **Submission** (~5, gray) are minimal.
- **Turn 2-4**:
- Total frequency ~200.
- **Localization (File)** peaks (~130, red), followed by **Editing** (~50, dark green).
- **Reproduction** (~20, bright green) and **Localization (Line)** (~10, orange) are smaller.
- **Submission** (~5, gray) remains low.
- **Turn 3-5**:
- Total frequency ~180.
- **Editing** (~100, dark green) and **Localization (File)** (~70, red) dominate.
- **Reproduction** (~10, bright green) and **Localization (Line)** (~5, orange) are minor.
- **Submission** (~5, gray) persists.
- **Turn 4-6**:
- Total frequency ~100.
- **Editing** (~50, dark green) and **Localization (File)** (~30, red) are prominent.
- **Reproduction** (~15, bright green) and **Localization (Line)** (~5, orange) are smaller.
- **Submission** (~5, gray) remains consistent.
- **Turn 5-7**:
- Total frequency ~60.
- **Editing** (~30, dark green) and **Localization (File)** (~20, red) lead.
- **Reproduction** (~5, bright green) and **Localization (Line)** (~5, orange) are minor.
- **Submission** (~5, gray) is present.
- **Turn 6-8**:
- Total frequency ~30.
- **Editing** (~20, dark green) and **Localization (File)** (~10, red) dominate.
- **Reproduction** (~5, bright green) and **Localization (Line)** (~5, orange) are small.
- **Submission** (~5, gray) is consistent.
- **Turn 7-9**:
- Total frequency ~40.
- **Editing** (~30, dark green) and **Localization (File)** (~10, red) are key.
- **Reproduction** (~5, bright green) and **Localization (Line)** (~5, orange) are minor.
- **Submission** (~5, gray) persists.
- **Turn 8-10**:
- Total frequency ~30.
- **Submission** peaks (~25, gray), with **Editing** (~5, dark green) and **Localization (File)** (~5, red).
- **Reproduction** (~5, bright green) and **Localization (Line)** (~5, orange) are minimal.
- **Turn 9-11**:
- Total frequency ~30.
- **Editing** (~20, dark green) and **Localization (File)** (~10, red) dominate.
- **Reproduction** (~5, bright green) and **Localization (Line)** (~5, orange) are small.
- **Submission** (~5, gray) is present.
- **Turn 10-12**:
- Total frequency ~5.
- **Localization (Line)** (~5, orange) and **Editing** (~5, dark green) are equal.
- Other categories are negligible.
- **Turn 11-13**:
- Total frequency ~5.
- **Localization (Line)** (~5, orange) dominates.
- Other categories are negligible.
- **Turn 12-14**:
- Total frequency ~5.
- **Localization (Line)** (~5, orange) dominates.
- Other categories are negligible.
### Key Observations
1. **Highest Frequency**: Turns 1-3 show the highest total frequency (~220), driven by **Editing** and **Localization (File)**.
2. **Dominant Categories**:
- **Editing** (dark green) is consistently high in early turns (1-5).
- **Localization (File)** (red) peaks in turns 2-4.
- **Submission** (gray) spikes in turn 8-10, suggesting a behavioral shift.
3. **Decline in Later Turns**: Total frequency drops sharply after turn 6-8, with later turns (<30) dominated by **Localization (Line)** and **Editing**.
4. **Color Consistency**: All segments align with the legend (e.g., orange = Localization Line, red = Localization File).
### Interpretation
The data suggests that early interactions (turns 1-5) involve heavy **Editing** and **Localization (File)**, while later turns (8-10) see a surge in **Submission**, possibly indicating a workflow phase (e.g., finalizing edits). The decline in total frequency after turn 6-8 may reflect reduced activity or a shift to simpler tasks (e.g., **Localization (Line)**). The consistent presence of **Submission** in later turns could signal a bottleneck or a finalization step in the process. Outliers like the **Submission** peak in 8-10 turns warrant further investigation into user behavior during that phase.