## Line Chart: Gradient Updates vs. Error for Different Dimensions
### Overview
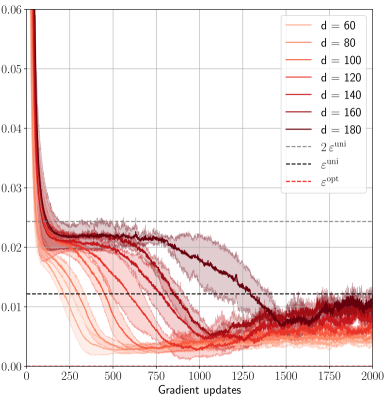
The image is a line chart showing the relationship between gradient updates (x-axis) and error (y-axis) for different values of 'd', which likely represents the dimensionality of a model or data. The chart also includes horizontal dashed lines representing epsilon values. The lines are colored in shades of red, with darker shades representing higher values of 'd'.
### Components/Axes
* **X-axis:** Gradient updates, ranging from 0 to 2000.
* **Y-axis:** Error, ranging from 0.00 to 0.06.
* **Legend (Top-Right):**
* `d = 60` (lightest red)
* `d = 80` (light red)
* `d = 100` (medium light red)
* `d = 120` (medium red)
* `d = 140` (medium dark red)
* `d = 160` (dark red)
* `d = 180` (darkest red)
* `2εᵘⁿⁱ` (dashed gray line)
* `εᵘⁿⁱ` (dashed black line)
* `εᵒᵖᵗ` (dashed red line)
### Detailed Analysis
* **General Trend:** All lines start with a rapid decrease in error in the first 250 gradient updates, followed by a more gradual decrease and eventual stabilization.
* **Specific Data Series:**
* **d = 60 (lightest red):** Starts at approximately 0.055, rapidly decreases to approximately 0.02 by 250 gradient updates, then gradually decreases to approximately 0.005 by 2000 gradient updates.
* **d = 80 (light red):** Starts at approximately 0.055, rapidly decreases to approximately 0.022 by 250 gradient updates, then gradually decreases to approximately 0.007 by 2000 gradient updates.
* **d = 100 (medium light red):** Starts at approximately 0.055, rapidly decreases to approximately 0.023 by 250 gradient updates, then gradually decreases to approximately 0.008 by 2000 gradient updates.
* **d = 120 (medium red):** Starts at approximately 0.055, rapidly decreases to approximately 0.024 by 250 gradient updates, then gradually decreases to approximately 0.009 by 2000 gradient updates.
* **d = 140 (medium dark red):** Starts at approximately 0.055, rapidly decreases to approximately 0.025 by 250 gradient updates, then gradually decreases to approximately 0.01 by 2000 gradient updates.
* **d = 160 (dark red):** Starts at approximately 0.055, rapidly decreases to approximately 0.026 by 250 gradient updates, then gradually decreases to approximately 0.011 by 2000 gradient updates.
* **d = 180 (darkest red):** Starts at approximately 0.055, decreases to approximately 0.027 by 250 gradient updates, then decreases more slowly, stabilizing around 0.02 between 1000 and 2000 gradient updates.
* **Horizontal Lines:**
* **2εᵘⁿⁱ (dashed gray line):** Located at approximately 0.024.
* **εᵘⁿⁱ (dashed black line):** Located at approximately 0.012.
* **εᵒᵖᵗ (dashed red line):** Located at approximately 0.001.
### Key Observations
* Higher values of 'd' (dimensionality) generally result in slower convergence and higher final error values.
* The error decreases rapidly in the initial gradient updates for all values of 'd'.
* The lines for lower values of 'd' (60, 80, 100, 120, 140) converge to a value close to `εᵒᵖᵗ`.
* The line for d=180 converges to a value close to `2εᵘⁿⁱ`.
### Interpretation
The chart illustrates the impact of dimensionality ('d') on the convergence of a gradient descent algorithm. The data suggests that increasing the dimensionality can hinder convergence, leading to higher final error values. The horizontal lines likely represent theoretical error bounds or target error values. The fact that lower dimensionalities converge close to `εᵒᵖᵗ` suggests that they are more effective in minimizing the error within the given number of gradient updates. The higher dimensionality (d=180) failing to converge to `εᵒᵖᵗ` and instead stabilizing near `2εᵘⁿⁱ` indicates a potential issue with training or optimization in high-dimensional spaces. This could be due to factors like increased complexity, vanishing gradients, or the need for more gradient updates to reach optimal performance.