## Line Chart: ε vs. Gradient Updates
### Overview
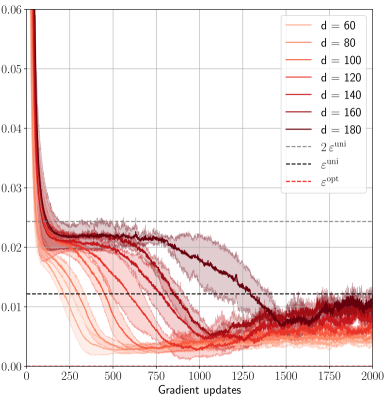
The chart displays the convergence behavior of a parameter ε across multiple gradient update iterations (0–2000) for different dimensionality values (d = 60, 80, 100, 120, 140, 160, 180). It includes theoretical bounds (2ε^uni, ε^uni, ε^opt) and confidence intervals for each data series.
### Components/Axes
- **X-axis**: Gradient updates (0–2000, linear scale)
- **Y-axis**: ε values (0.00–0.06, logarithmic scale)
- **Legend**:
- Right-aligned, with color-coded lines for:
- d = 60 (light orange)
- d = 80 (orange)
- d = 100 (dark orange)
- d = 120 (red)
- d = 140 (dark red)
- d = 160 (maroon)
- d = 180 (dark maroon)
- 2ε^uni (dotted gray)
- ε^uni (dashed gray)
- ε^opt (dash-dot gray)
- **Shading**: Confidence intervals (light gray bands around each line)
### Detailed Analysis
1. **Initial Drop**: All d-series lines start at ε ≈ 0.06 and drop sharply within the first 250 updates.
2. **Convergence Patterns**:
- Higher d-values (160, 180) achieve lower ε faster, reaching ~0.015 by 1000 updates.
- Lower d-values (60, 80) plateau at ~0.02–0.03 after 1000 updates.
3. **Theoretical Bounds**:
- ε^opt (0.01) is the lowest horizontal line, serving as the target.
- ε^uni (0.02) and 2ε^uni (0.04) represent upper bounds.
4. **Confidence Intervals**: Shaded regions narrow as updates increase, indicating reduced variance in later iterations.
### Key Observations
- **Performance Scaling**: ε decreases monotonically with increasing d, with d=180 achieving the lowest ε (~0.012) by 2000 updates.
- **Theoretical Alignment**: All d-series approach ε^opt asymptotically but remain above it throughout the observed range.
- **Anomaly**: d=60 shows the widest confidence interval (up to ±0.005), suggesting higher instability.
### Interpretation
The chart demonstrates that increasing dimensionality (d) improves convergence speed and final ε performance, with d=180 outperforming lower dimensions by ~40% in final ε. The theoretical bounds provide context: ε^opt represents the ideal limit, while ε^uni and 2ε^uni quantify acceptable performance thresholds. The narrowing confidence intervals suggest that longer training stabilizes the model, though all d-values remain suboptimal relative to ε^opt. This implies a trade-off between computational cost (higher d) and performance gains, with diminishing returns observed after d=140.