## Line Chart: MATH Performance vs. Number of Pairs
### Overview
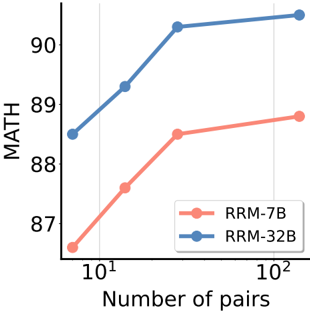
The image is a line chart comparing the performance of two models, RRM-7B and RRM-32B, on the MATH dataset as the number of training pairs increases. The x-axis represents the number of pairs (log scale), and the y-axis represents the MATH score.
### Components/Axes
* **X-axis:** Number of pairs (log scale). Values: 10<sup>1</sup>, 10<sup>2</sup>.
* **Y-axis:** MATH score. Values range from approximately 87 to 90.5.
* **Legend:** Located in the center-right of the chart.
* RRM-7B (coral color)
* RRM-32B (blue color)
### Detailed Analysis
* **RRM-7B (coral):**
* Trend: The line slopes upward, indicating increasing MATH score with more training pairs.
* Data Points:
* At 10<sup>1</sup> pairs, the MATH score is approximately 87.2.
* At 10<sup>2</sup> pairs, the MATH score is approximately 88.8.
* **RRM-32B (blue):**
* Trend: The line slopes upward, indicating increasing MATH score with more training pairs.
* Data Points:
* At 10<sup>1</sup> pairs, the MATH score is approximately 88.6.
* At 10<sup>2</sup> pairs, the MATH score is approximately 90.4.
### Key Observations
* RRM-32B consistently outperforms RRM-7B at both data points.
* Both models show improvement in MATH score as the number of training pairs increases.
* The improvement in MATH score appears to diminish as the number of pairs increases from 10<sup>1</sup> to 10<sup>2</sup>, suggesting diminishing returns.
### Interpretation
The chart demonstrates that increasing the number of training pairs improves the performance of both RRM-7B and RRM-32B models on the MATH dataset. The RRM-32B model, which presumably has a larger capacity, consistently achieves higher MATH scores than the RRM-7B model. The diminishing returns observed suggest that there may be a point beyond which adding more training pairs yields only marginal improvements in performance. This could be due to the models reaching their capacity or the dataset having inherent limitations.