## Line Graph: response_length/mean
### Overview
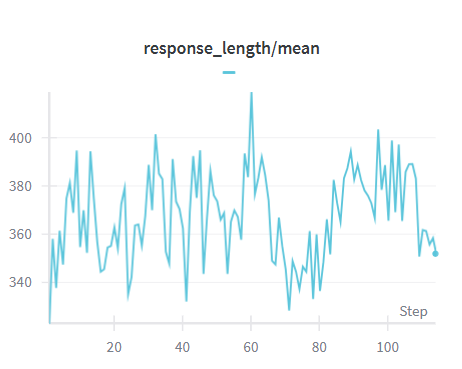
The image depicts a line graph titled "response_length/mean" with a blue line representing data fluctuations across a numerical axis labeled "Step" (0–100). The y-axis is labeled "response_length/mean" and ranges from 340 to 400. The line exhibits significant variability, with peaks and troughs throughout the range.
### Components/Axes
- **Title**: "response_length/mean" (centered at the top).
- **X-axis (Step)**: Labeled "Step," with grid markers at 20, 40, 60, 80, and 100. The axis spans from 0 to 100.
- **Y-axis (response_length/mean)**: Labeled "response_length/mean," with grid lines at 340, 360, 380, and 400. The axis spans from 340 to 400.
- **Legend**: Located at the bottom-right corner, featuring a blue line labeled "response_length/mean."
- **Gridlines**: Horizontal gridlines at 340, 360, 380, and 400; vertical gridlines at 20, 40, 60, 80, and 100.
### Detailed Analysis
- **Line Behavior**:
- **Initial Trend (Steps 0–20)**: The line starts at approximately 340, rises sharply to ~380 by step 20, then dips to ~360 by step 30.
- **Mid-Range Fluctuations (Steps 30–60)**: The line oscillates between ~350 and ~390, peaking at ~400 near step 60.
- **Late Trend (Steps 60–100)**: After step 60, the line declines steadily, dropping to ~350 by step 100. Smaller fluctuations persist, with a notable dip to ~340 near step 90.
### Key Observations
1. **Peak at Step 60**: The line reaches its maximum value (~400) near step 60, suggesting a critical point of high response length.
2. **Decline Post-Step 60**: A consistent downward trend occurs after step 60, ending at ~350 by step 100.
3. **High Variability**: The line exhibits frequent sharp rises and falls, indicating instability or variability in the measured response length.
4. **Final Value**: The line terminates at ~350 at step 100, lower than its starting value (~340 at step 0).
### Interpretation
The graph demonstrates that response length varies significantly across steps, with a pronounced peak at step 60. This could indicate a specific event, condition, or threshold where responses are longest. The subsequent decline suggests diminishing response length as steps increase beyond 60. The high variability implies potential inconsistencies in data collection or external factors influencing the measured values. The final value (~350) being higher than the initial (~340) might reflect a net increase in response length over the observed range, despite the overall downward trend post-step 60.