\n
## Bar Chart: Best-of-8 Mean Accuracy Comparison
### Overview
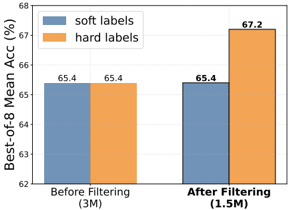
This bar chart compares the Best-of-8 Mean Accuracy (%) achieved using "soft labels" and "hard labels" before and after filtering a dataset. The x-axis represents the filtering status (Before Filtering and After Filtering), and the y-axis represents the Best-of-8 Mean Accuracy (%). Each filtering status has two bars, one for soft labels and one for hard labels.
### Components/Axes
* **X-axis Title:** Filtering Status
* Markers: "Before Filtering (3M)", "After Filtering (1.5M)"
* **Y-axis Title:** Best-of-8 Mean Acc (%)
* Scale: 62% to 68%
* **Legend:** Located at the top-left corner.
* Blue: "soft labels"
* Orange: "hard labels"
### Detailed Analysis
The chart presents four data points, each represented by a bar.
* **Before Filtering (3M) - Soft Labels:** The blue bar for "Before Filtering" reaches approximately 65.4% accuracy. The bar is positioned on the left side of the chart.
* **Before Filtering (3M) - Hard Labels:** The orange bar for "Before Filtering" reaches approximately 65.4% accuracy. This bar is adjacent to the soft labels bar.
* **After Filtering (1.5M) - Soft Labels:** The blue bar for "After Filtering" reaches approximately 65.4% accuracy. This bar is positioned on the right side of the chart.
* **After Filtering (1.5M) - Hard Labels:** The orange bar for "After Filtering" reaches approximately 67.2% accuracy. This bar is adjacent to the soft labels bar.
The trend for soft labels is flat, remaining at 65.4% before and after filtering. The trend for hard labels is upward, increasing from 65.4% to 67.2% after filtering.
### Key Observations
* Before filtering, the accuracy for both soft and hard labels is identical (65.4%).
* After filtering, the accuracy for hard labels significantly increases to 67.2%, while the accuracy for soft labels remains constant.
* The dataset size is reduced from 3M to 1.5M after filtering.
### Interpretation
The data suggests that filtering the dataset has a positive impact on the performance of models trained with "hard labels," increasing their Best-of-8 Mean Accuracy by approximately 1.8%. However, filtering does not improve the performance of models trained with "soft labels." This could indicate that "hard labels" benefit more from a reduced and potentially cleaner dataset, while "soft labels" are less sensitive to the dataset size or quality. The difference in performance after filtering highlights the potential benefits of data filtering techniques, particularly when using "hard labels" for training. The numbers in parenthesis after the labels indicate the size of the dataset used. The filtering process reduces the dataset size by half. The consistent performance of soft labels suggests they are more robust to changes in dataset size or composition.