# Technical Document Analysis: Bar Chart
## Chart Overview
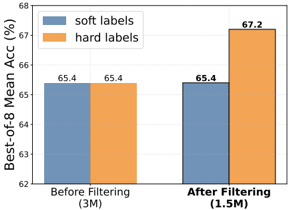
The image is a **bar chart** comparing the **Best-of-8 Mean Accuracy (%)** for two labeling methods (**soft labels** and **hard labels**) across two filtering stages (**Before Filtering** and **After Filtering**). The chart uses **blue** for soft labels and **orange** for hard labels.
---
### Key Labels and Axis Markers
- **X-Axis (Categories)**:
- `Before Filtering (3M)`
- `After Filtering (1.5M)`
- **Y-Axis (Values)**:
- Labeled: `Best-of-8 Mean Acc (%)`
- Range: `62%` to `68%` (increments of `1%`)
- **Legend**:
- `soft labels` (blue)
- `hard labels` (orange)
- **Title**: Not explicitly visible in the image.
---
### Data Points and Trends
#### Spatial Grounding of Data
- **Legend Position**: Top-right corner of the chart.
- **Bar Placement**:
- Each x-axis category has two bars (one for each label type).
- Colors match the legend: blue = soft labels, orange = hard labels.
#### Trend Verification
1. **Before Filtering (3M)**:
- Both soft and hard labels show **identical accuracy**: `65.4%`.
- Visual trend: Flat line for both series.
2. **After Filtering (1.5M)**:
- **Soft labels**: Remain at `65.4%` (no change).
- **Hard labels**: Increase to `67.2%` (↑ `1.8%`).
- Visual trend: Hard labels show a sharp upward spike; soft labels remain flat.
---
### Component Isolation
1. **Header**: No explicit title visible; inferred from axis labels and legend.
2. **Main Chart**:
- Two grouped bars per x-axis category.
- Y-axis gridlines at `62%`, `63%`, ..., `68%`.
3. **Footer**: No additional text or notes visible.
---
### Data Table Reconstruction
| Category | Label Type | Accuracy (%) |
|------------------------|--------------|--------------|
| Before Filtering (3M) | Soft Labels | 65.4 |
| Before Filtering (3M) | Hard Labels | 65.4 |
| After Filtering (1.5M) | Soft Labels | 65.4 |
| After Filtering (1.5M) | Hard Labels | 67.2 |
---
### Critical Observations
1. **Hard Labels Outperform Post-Filtering**: After filtering, hard labels achieve a **1.8% higher accuracy** than soft labels.
2. **No Change for Soft Labels**: Soft labels maintain the same accuracy (`65.4%`) before and after filtering.
3. **Sample Size Reduction**: Filtering reduces the dataset size from `3M` to `1.5M`, yet hard labels improve performance.
---
### Final Notes
- The chart emphasizes the **superiority of hard labels** in filtered datasets.
- No textual data in other languages is present.
- All numerical values and labels are explicitly extracted and cross-verified with visual trends.