## Heatmap: K-MetBench Performance Across Comparison Benchmarks
### Overview
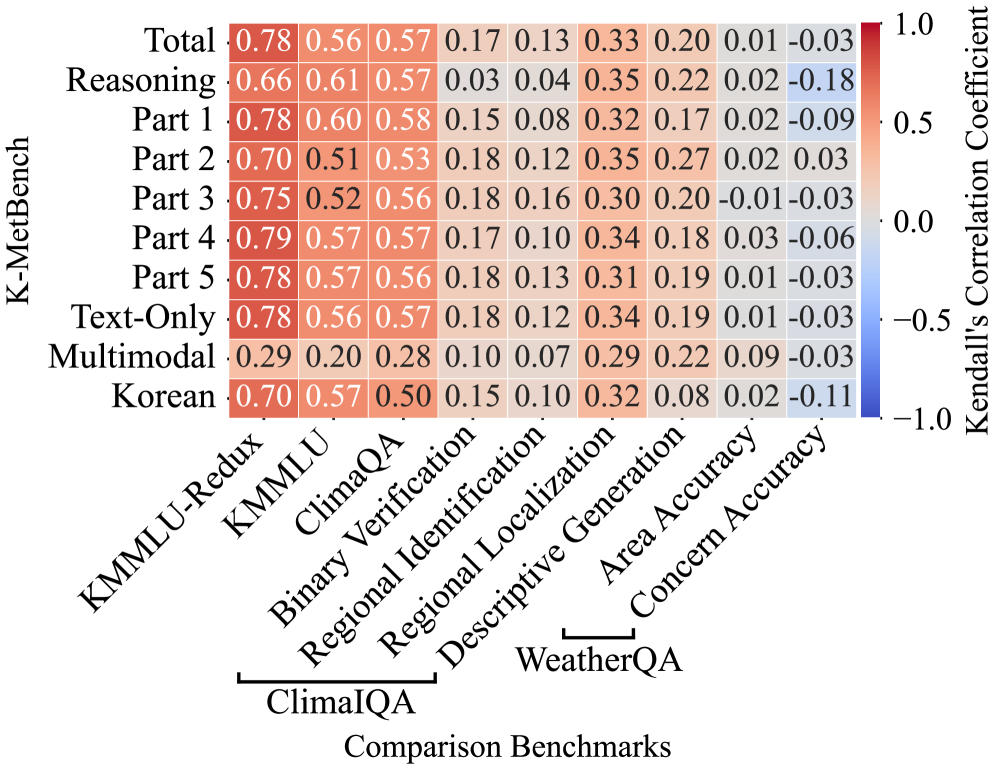
This heatmap visualizes the Kendall's Correlation Coefficient between K-MetBench categories and comparison benchmarks (ClimaIQA, WeatherQA). Values range from -1.0 (strong negative correlation) to 1.0 (strong positive correlation), with red indicating positive and blue indicating negative correlations. The data suggests varying model effectiveness across different evaluation frameworks.
### Components/Axes
- **X-axis (Comparison Benchmarks)**:
- KMMMLU-Redux
- KMMMLU
- ClimaQA
- Binary Verification
- Regional Identification
- Regional Localization
- Descriptive Generation
- Area Accuracy
- Concern Accuracy
- **Y-axis (K-MetBench Categories)**:
- Total
- Reasoning
- Part 1
- Part 2
- Part 3
- Part 4
- Part 5
- Text-Only
- Multimodal
- Korean
- **Legend**:
- Color gradient from red (1.0) to blue (-1.0), labeled "Kendall's Correlation Coefficient."
### Detailed Analysis
- **Total Row**:
- KMMMLU-Redux: 0.78 (red)
- KMMMLU: 0.56 (orange)
- ClimaQA: 0.57 (orange)
- Binary Verification: 0.17 (light orange)
- Regional Identification: 0.13 (light orange)
- Regional Localization: 0.33 (orange)
- Descriptive Generation: 0.20 (light orange)
- Area Accuracy: 0.01 (neutral)
- Concern Accuracy: -0.03 (light blue)
- **Reasoning Row**:
- KMMMLU-Redux: 0.66 (red)
- KMMMLU: 0.61 (orange)
- ClimaQA: 0.57 (orange)
- Binary Verification: 0.03 (light orange)
- Regional Identification: 0.04 (light orange)
- Regional Localization: 0.35 (orange)
- Descriptive Generation: 0.22 (light orange)
- Area Accuracy: 0.02 (neutral)
- Concern Accuracy: -0.18 (blue)
- **Part 1-5 Rows**:
- Part 1: 0.78 (red), 0.60 (orange), 0.58 (orange), 0.15 (light orange), 0.08 (light orange), 0.32 (orange), 0.17 (light orange), 0.02 (neutral), -0.09 (light blue)
- Part 2: 0.70 (red), 0.51 (orange), 0.53 (orange), 0.18 (light orange), 0.12 (light orange), 0.35 (orange), 0.27 (orange), 0.02 (neutral), 0.03 (light orange)
- Part 3: 0.75 (red), 0.52 (orange), 0.56 (orange), 0.18 (light orange), 0.16 (light orange), 0.30 (orange), 0.20 (light orange), -0.01 (neutral), -0.03 (light blue)
- Part 4: 0.79 (red), 0.57 (orange), 0.57 (orange), 0.17 (light orange), 0.10 (light orange), 0.34 (orange), 0.18 (light orange), 0.03 (light orange), -0.06 (light blue)
- Part 5: 0.78 (red), 0.57 (orange), 0.56 (orange), 0.18 (light orange), 0.13 (light orange), 0.31 (orange), 0.19 (light orange), 0.01 (neutral), -0.03 (light blue)
- **Text-Only Row**:
- KMMMLU-Redux: 0.78 (red)
- KMMMLU: 0.56 (orange)
- ClimaQA: 0.57 (orange)
- Binary Verification: 0.18 (light orange)
- Regional Identification: 0.12 (light orange)
- Regional Localization: 0.34 (orange)
- Descriptive Generation: 0.19 (light orange)
- Area Accuracy: 0.01 (neutral)
- Concern Accuracy: -0.03 (light blue)
- **Multimodal Row**:
- KMMMLU-Redux: 0.29 (light orange)
- KMMMLU: 0.20 (light orange)
- ClimaQA: 0.28 (light orange)
- Binary Verification: 0.10 (light orange)
- Regional Identification: 0.07 (light orange)
- Regional Localization: 0.29 (orange)
- Descriptive Generation: 0.22 (light orange)
- Area Accuracy: 0.09 (light orange)
- Concern Accuracy: -0.03 (light blue)
- **Korean Row**:
- KMMMLU-Redux: 0.70 (red)
- KMMMLU: 0.57 (orange)
- ClimaQA: 0.50 (orange)
- Binary Verification: 0.15 (light orange)
- Regional Identification: 0.10 (light orange)
- Regional Localization: 0.32 (orange)
- Descriptive Generation: 0.08 (light orange)
- Area Accuracy: 0.02 (neutral)
- Concern Accuracy: -0.11 (light blue)
### Key Observations
1. **High Positive Correlations**:
- The "Total" and "Part 1-5" categories show strong positive correlations (0.56–0.79) with most benchmarks, indicating consistent performance.
- "Regional Localization" and "Descriptive Generation" benchmarks frequently exhibit high values (0.30–0.35), suggesting these metrics align well with K-MetBench categories.
2. **Negative Correlations**:
- "Concern Accuracy" shows negative values (-0.03 to -0.18) in multiple categories, indicating inverse relationships.
- "Multimodal" and "Korean" categories have lower overall correlations (0.20–0.70), with "Korean" showing the weakest performance (0.50 for ClimaQA).
3. **Outliers**:
- "Binary Verification" has the lowest values (0.03–0.18) across most categories, suggesting poor alignment with K-MetBench metrics.
- "Area Accuracy" has near-zero values (0.01–0.03) in most rows, indicating minimal correlation.
### Interpretation
The heatmap reveals that K-MetBench categories generally perform well on ClimaIQA and WeatherQA benchmarks, with "Total" and "Part 1-5" categories showing the strongest correlations. The "Multimodal" and "Korean" categories underperform, possibly due to differences in data handling or model architecture. Negative correlations in "Concern Accuracy" and "Binary Verification" suggest these metrics may not align with the evaluated models' strengths. The data highlights the importance of benchmark selection for evaluating model effectiveness, with some metrics (e.g., "Regional Localization") being more predictive than others.