## Decision Table and Decision Changes for mTPI and mTPI-2
### Overview
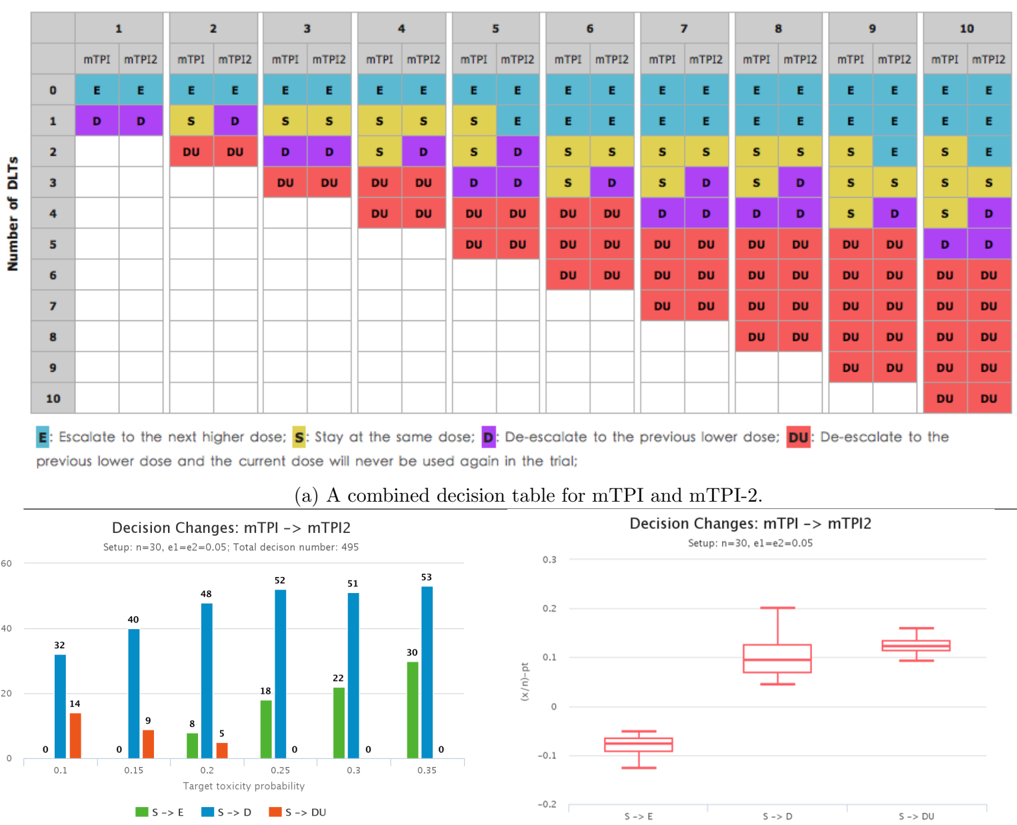
The image presents a combined decision table for two methods, mTPI and mTPI-2, along with two bar charts and two box plots illustrating decision changes between the two methods. The decision table shows dose escalation/de-escalation strategies based on the number of DLTs (Dose-Limiting Toxicities) observed. The bar charts quantify the number of decision changes (S -> E, S -> D, S -> DU) at different target toxicity probabilities. The box plots show the distribution of (x/n)-pt values for each type of decision change.
### Components/Axes
**1. Decision Table:**
* **Title:** (a) A combined decision table for mTPI and mTPI-2.
* **Rows:** Number of DLTs (0 to 10).
* **Columns:** Dose levels (1 to 10), each split into mTPI and mTPI2.
* **Cells:** Contain decisions:
* E: Escalate to the next higher dose (Green).
* S: Stay at the same dose (Yellow).
* D: De-escalate to the previous lower dose (Purple).
* DU: De-escalate to the previous lower dose and the current dose will never be used again in the trial (Red).
**2. Bar Chart (Left):**
* **Title:** Decision Changes: mTPI -> mTPI2
* **Setup:** n=30, e1=e2=0.05; Total decision number: 495
* **X-axis:** Target toxicity probability (0.1, 0.15, 0.2, 0.25, 0.3, 0.35).
* **Y-axis:** Number of DLTs.
* **Bars:** Represent the number of decision changes for:
* S -> E (Blue).
* S -> D (Green).
* S -> DU (Red).
**3. Box Plot (Right):**
* **Title:** Decision Changes: mTPI -> mTPI2
* **Setup:** n=30, e1=e2=0.05
* **X-axis:** Decision changes (S -> E, S -> D, S -> DU).
* **Y-axis:** (x/n)-pt.
### Detailed Analysis
**1. Decision Table:**
The table dictates the decision (E, S, D, DU) for each dose level (1-10) and number of DLTs (0-10) for both mTPI and mTPI2. For example:
* At dose level 1, with 0 DLTs, both mTPI and mTPI2 recommend escalating (E).
* At dose level 1, with 1 DLT, both mTPI and mTPI2 recommend de-escalating (D).
* At dose level 2, with 2 DLTs, both mTPI and mTPI2 recommend de-escalating to the previous lower dose and the current dose will never be used again in the trial (DU).
**2. Bar Chart (Left):**
* **S -> E (Blue):** The number of S -> E changes increases with target toxicity probability.
* 0.1: 32
* 0.15: 40
* 0.2: 48
* 0.25: 52
* 0.3: 51
* 0.35: 53
* **S -> D (Green):** The number of S -> D changes peaks at a target toxicity probability of 0.3.
* 0.1: 0
* 0.15: 0
* 0.2: 8
* 0.25: 18
* 0.3: 22
* 0.35: 30
* **S -> DU (Red):** The number of S -> DU changes decreases with target toxicity probability.
* 0.1: 14
* 0.15: 9
* 0.2: 5
* 0.25: 0
* 0.3: 0
* 0.35: 0
**3. Box Plot (Right):**
* **S -> E:** The median (x/n)-pt value is slightly negative (approximately -0.05). The box extends from approximately -0.12 to -0.02.
* **S -> D:** The median (x/n)-pt value is approximately 0.08. The box extends from approximately 0.05 to 0.18.
* **S -> DU:** The median (x/n)-pt value is approximately 0.12. The box extends from approximately 0.09 to 0.15.
### Key Observations
* The decision table provides a clear, rule-based approach to dose escalation/de-escalation.
* As the target toxicity probability increases, mTPI2 is more likely to escalate (S -> E) compared to mTPI.
* As the target toxicity probability increases, mTPI2 is less likely to de-escalate to the previous lower dose and the current dose will never be used again in the trial (S -> DU) compared to mTPI.
* The (x/n)-pt values suggest that S -> DU decisions have the highest positive impact, while S -> E decisions have a slightly negative impact.
### Interpretation
The data suggests that mTPI2 tends to be more aggressive in dose escalation as the target toxicity probability increases, while mTPI is more conservative. The (x/n)-pt values indicate the relative impact of each decision type, with S -> DU decisions potentially leading to better outcomes. The decision table provides a structured framework for making dose adjustments based on observed toxicities, while the charts and box plots offer insights into the differences between mTPI and mTPI2 in terms of decision-making and potential impact.