## Heatmap & Bar Charts: Decision Table and Decision Changes
### Overview
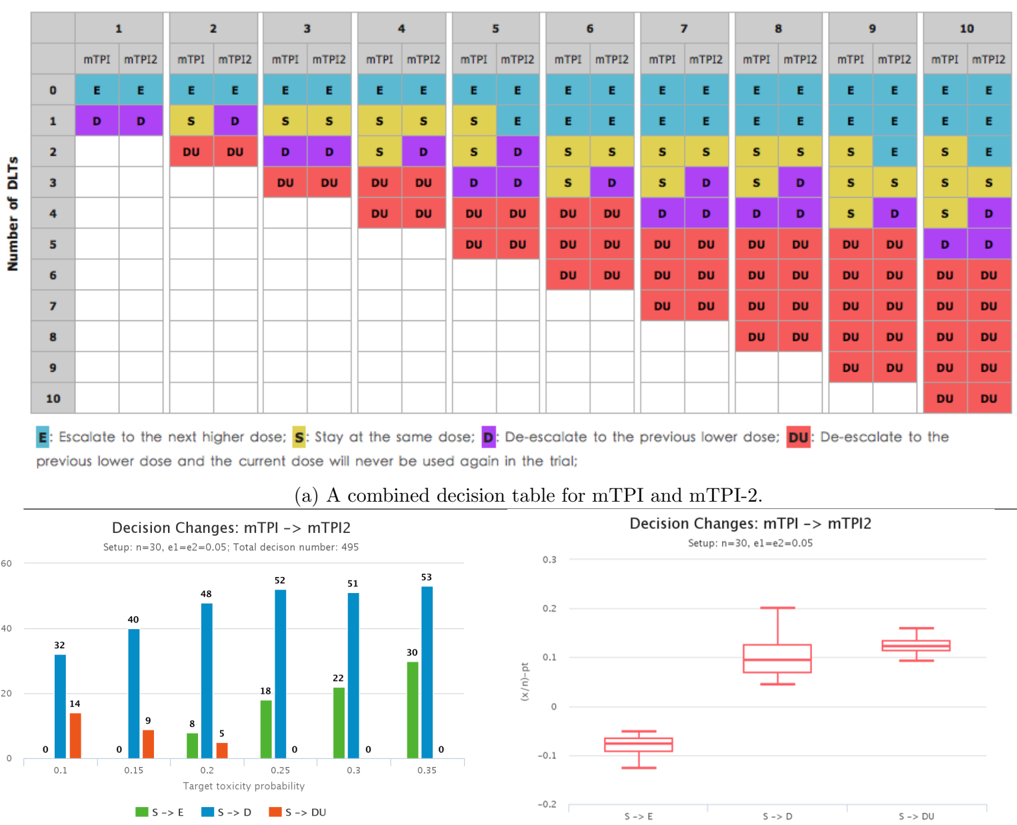
The image presents a combined decision table for mTP1 and mTP1-2, alongside two bar charts illustrating decision changes from mTP1 to mTP1-2 and mTP1 to mTP12. The heatmap visualizes decisions (Escalate, Stay, De-escalate) based on the number of DLTs (Dose Limiting Toxicities) observed and the treatment protocol (mTP1 or mTP1-2). The bar charts show the frequency of different decisions based on target toxicity probability.
### Components/Axes
* **Heatmap:**
* X-axis: Columns 1 through 10, representing different treatment cycles or patients. Each column is split into two sections: mTP1 and mTP1-2.
* Y-axis: Number of DLTs, ranging from 0 to 10.
* Cells: Colored cells representing decisions:
* 'E' (Light Blue): Escalate to the next higher dose.
* 'S' (Yellow): Stay at the same dose.
* 'D' (Orange): De-escalate to the previous lower dose.
* 'DU' (Dark Orange): De-escalate to the previous lower dose and the current dose will never be used again in the trial.
* **Bar Chart 1 (mTP1 -> mTP1-2):**
* X-axis: Target toxicity probability (0.15, 0.2, 0.25, 0.3, 0.35).
* Y-axis: Frequency (approximately 0 to 60).
* Bars: Two sets of bars for each toxicity probability:
* 'S -> E' (Red): Represents the transition from Stay to Escalate.
* 'S -> DU' (Blue): Represents the transition from Stay to De-escalate/Discontinue Use.
* **Bar Chart 2 (mTP1 -> mTP12):**
* X-axis: Decision Changes (S -> E, S -> DU).
* Y-axis: (p)/-rt (approximately -0.2 to 0.2).
* Box Plots: Representing the distribution of (p)/-rt for each decision change.
* **Legend:** Located below the heatmap, explaining the color codes for the decisions (E, S, D, DU).
* **Title:** "(a) A combined decision table for mTP1 and mTP1-2"
* **Setup Information:** "Setup: n=30, e1=e2=0.05; Total decision number: 495" (below the first bar chart) and "Setup: n=30, e1=e2=0.05" (below the second bar chart).
### Detailed Analysis or Content Details
**Heatmap Analysis:**
The heatmap shows a pattern of decisions based on the number of DLTs. Generally, as the number of DLTs increases, the decision shifts from 'E' (Escalate) to 'S' (Stay) and then to 'D' (De-escalate) or 'DU' (De-escalate/Discontinue Use).
* **mTP1 (Left side of each column):**
* Columns 1-3: Predominantly 'E' for 0-2 DLTs.
* Columns 4-6: Transition to 'S' and 'D' as DLTs increase.
* Columns 7-10: Primarily 'D' and 'DU' for higher DLT counts.
* **mTP1-2 (Right side of each column):**
* Columns 1-6: Predominantly 'E' and 'S' for 0-2 DLTs.
* Columns 7-10: Transition to 'S', 'D' and 'DU' as DLTs increase.
**Bar Chart 1 (mTP1 -> mTP1-2):**
* Target Toxicity Probability 0.15: 'S -> E' is approximately 14, 'S -> DU' is approximately 40.
* Target Toxicity Probability 0.2: 'S -> E' is approximately 9, 'S -> DU' is approximately 48.
* Target Toxicity Probability 0.25: 'S -> E' is approximately 18, 'S -> DU' is approximately 52.
* Target Toxicity Probability 0.3: 'S -> E' is approximately 22, 'S -> DU' is approximately 51.
* Target Toxicity Probability 0.35: 'S -> E' is approximately 30, 'S -> DU' is approximately 53.
* The 'S -> DU' bar is consistently higher than the 'S -> E' bar across all toxicity probabilities.
**Bar Chart 2 (mTP1 -> mTP12):**
* S -> E: The boxplot is centered around approximately 0.05, with a range from approximately -0.1 to 0.15.
* S -> DU: The boxplot is centered around approximately -0.1, with a range from approximately -0.2 to 0.05.
### Key Observations
* The heatmap demonstrates a clear dose escalation/de-escalation strategy based on observed DLTs.
* The first bar chart shows that de-escalation/discontinuation ('S -> DU') is the more frequent decision compared to escalation ('S -> E') across all target toxicity probabilities.
* The second bar chart suggests that the (p)/-rt value is generally lower for decisions leading to de-escalation/discontinuation (S -> DU) compared to escalation (S -> E).
* The setup information indicates a sample size of n=30 and a specified error rate (e1=e2=0.05).
### Interpretation
The data suggests a conservative approach to dose escalation in the clinical trial. The frequent de-escalation/discontinuation decisions ('S -> DU') indicate a strong emphasis on patient safety and minimizing toxicity. The heatmap visually represents the decision-making process, showing how the protocol adapts based on the number of DLTs observed. The bar charts provide quantitative support for this observation, highlighting the prevalence of de-escalation and its association with lower (p)/-rt values. The (p)/-rt values in the second bar chart could represent a risk metric, where lower values indicate a higher risk associated with the decision. The consistent higher frequency of 'S -> DU' suggests that the trial prioritizes avoiding severe toxicities, even if it means potentially sacrificing some efficacy. The setup information (n=30, e1=e2=0.05) provides context for the statistical power and error rates associated with the decision-making process.