TECHNICAL ASSET FINGERPRINT
912d3615f81e4c17dd3b83d5
Click to view fullscreen
Press ESC or click to close
FOUND IN PAPERS
EXPERT: healer-alpha-free VERSION 1
RUNTIME: free/openrouter/healer-alpha
INTEL_VERIFIED
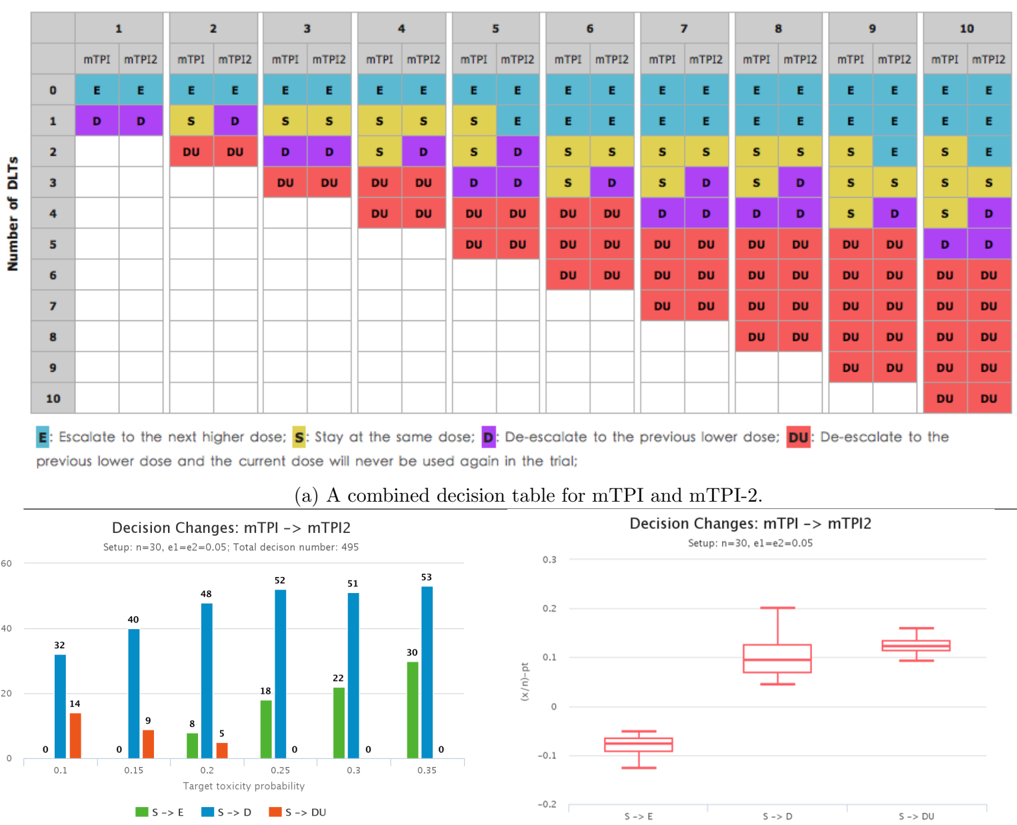
## Combined Decision Table and Analysis: mTPI vs. mTPI-2 Dose-Finding Algorithms
### Overview
The image presents a technical analysis comparing two dose-finding algorithms, mTPI and mTPI-2, used in clinical trials to determine dose escalation based on the number of Dose-Limiting Toxicities (DLTs). It consists of three primary components: a large decision table, a bar chart showing decision change frequencies, and a box plot showing the distribution of probability differences.
### Components/Axes
**1. Decision Table (Top Section)**
* **Title:** (a) A combined decision table for mTPI and mTPI-2.
* **Structure:** A grid with 11 rows (labeled "Number of DLTs" from 0 to 10) and 10 main columns (labeled 1 through 10, representing dose levels). Each dose level column is subdivided into two sub-columns: "mTPI" and "mTPI2".
* **Legend (Bottom of Table):**
* **E (Blue):** Escalate to the next higher dose.
* **S (Yellow):** Stay at the same dose.
* **D (Purple):** De-escalate to the previous lower dose.
* **DU (Red):** De-escalate to the previous lower dose and the current dose will never be used again in the trial.
* **Spatial Grounding:** The legend is positioned directly below the table, aligned to the left. The table itself occupies the top half of the image.
**2. Bar Chart (Bottom Left)**
* **Title:** Decision Changes: mTPI -> mTPI2
* **Subtitle/Setup:** Setup: n=30, e1=e2=0.05; Total decision number: 495
* **X-axis:** "Target toxicity probability" with categorical values: 0.1, 0.15, 0.2, 0.25, 0.3, 0.35.
* **Y-axis:** Unlabeled, but represents the count or frequency of decision changes. Scale ranges from 0 to 60.
* **Legend (Bottom of Chart):**
* **Green Bar:** S -> E (Decision changes from "Stay" under mTPI to "Escalate" under mTPI-2).
* **Blue Bar:** S -> D (Decision changes from "Stay" under mTPI to "De-escalate" under mTPI-2).
* **Orange Bar:** S -> DU (Decision changes from "Stay" under mTPI to "De-escalate and Drop" under mTPI-2).
**3. Box Plot (Bottom Right)**
* **Title:** Decision Changes: mTPI -> mTPI2
* **Subtitle/Setup:** Setup: n=30, e1=e2=0.05
* **X-axis:** Categories of decision changes: "S -> E", "S -> D", "S -> DU".
* **Y-axis:** Label is "(p1-p2)". Scale ranges from -0.2 to 0.3. This represents the difference in the underlying toxicity probability estimates between the two algorithms for cases where the decision changed.
* **Data Series:** Three box plots, one for each category on the x-axis.
### Detailed Analysis
**A. Decision Table Analysis**
The table maps the decision (E, S, D, DU) for each combination of Dose Level (1-10) and Number of DLTs (0-10) for both algorithms.
* **Trend Verification:** For a fixed dose level, as the number of DLTs increases (moving down a column), the decision consistently shifts from Escalate (E) -> Stay (S) -> De-escalate (D) -> De-escalate and Drop (DU). This is a logical safety progression.
* **Algorithm Comparison:** For the same cell (same dose and DLT count), mTPI and mTPI-2 often show different decisions. For example, at Dose Level 5 with 1 DLT: mTPI says "E" (Escalate), while mTPI-2 says "E" as well. At Dose Level 5 with 2 DLTs: mTPI says "S", mTPI-2 says "D". This indicates mTPI-2 is generally more conservative (prone to de-escalation) than mTPI for the same observed toxicity.
**B. Bar Chart Data Points (Approximate Values)**
* **Target Toxicity 0.1:** S->E: 0, S->D: 32, S->DU: 14
* **Target Toxicity 0.15:** S->E: 0, S->D: 40, S->DU: 9
* **Target Toxicity 0.2:** S->E: 8, S->D: 48, S->DU: 5
* **Target Toxicity 0.25:** S->E: 18, S->D: 52, S->DU: 0
* **Target Toxicity 0.3:** S->E: 22, S->D: 51, S->DU: 0
* **Target Toxicity 0.35:** S->E: 30, S->D: 53, S->DU: 0
* **Trend:** As the target toxicity probability increases, the number of "S -> D" changes remains high and relatively stable (32 to 53). The number of "S -> E" changes increases significantly (0 to 30). The number of "S -> DU" changes decreases and drops to zero for target toxicities of 0.25 and above.
**C. Box Plot Data (Visual Approximation)**
* **S -> E:** The box is centered below zero, with a median around -0.08. The interquartile range (IQR) spans approximately -0.1 to -0.05. Whiskers extend from about -0.12 to -0.02. This indicates that when mTPI-2 recommends escalation where mTPI recommended staying, the estimated toxicity probability (p2) under mTPI-2 is generally *higher* than that under mTPI (p1), resulting in a negative (p1-p2).
* **S -> D:** The box is centered above zero, with a median around 0.08. The IQR spans approximately 0.05 to 0.12. Whiskers extend from about 0.02 to 0.18. This indicates that when mTPI-2 recommends de-escalation where mTPI recommended staying, the estimated toxicity probability (p2) under mTPI-2 is generally *lower* than that under mTPI (p1), resulting in a positive (p1-p2).
* **S -> DU:** The box is also centered above zero, with a median slightly higher than S->D, around 0.12. The IQR is tighter, spanning approximately 0.1 to 0.14. Whiskers extend from about 0.08 to 0.16. This shows a similar but more pronounced pattern than S->D.
### Key Observations
1. **Conservative Shift:** The primary effect of moving from mTPI to mTPI-2 is a shift towards more conservative decisions (more "S -> D" and "S -> DU", fewer "S -> E").
2. **Toxicity Target Dependence:** The nature of the decision change is highly dependent on the pre-specified target toxicity probability. At low targets (0.1, 0.15), changes are almost exclusively towards de-escalation (D/DU). At higher targets (0.25+), a significant number of changes towards escalation (E) appear, while the most severe de-escalation (DU) disappears.
3. **Algorithmic Behavior:** The box plot quantifies the probabilistic reasoning behind the changes. mTPI-2 appears to have a different internal model for estimating toxicity risk, leading it to be more cautious (higher p2 for de-escalation decisions) or more aggressive (higher p2 for escalation decisions) than mTPI in specific scenarios.
### Interpretation
This analysis demonstrates the operational differences between the mTPI and mTPI-2 dose-finding algorithms. The data suggests that mTPI-2 is designed to be a more risk-averse successor. Its decision table shows a quicker progression to de-escalation and dose-dropping as toxicities accumulate within a cohort.
The bar chart reveals that this conservatism is not absolute but is modulated by the trial's target toxicity rate. When the acceptable toxicity level is low, mTPI-2 almost always corrects mTPI's "Stay" decisions towards greater caution. However, when the target is higher, mTPI-2 sometimes interprets the same data as a signal to escalate, suggesting it may be more efficient at identifying tolerable doses in higher-risk settings.
The box plot provides the statistical underpinning: the decisions change because the algorithms' underlying estimates of the current dose's toxicity probability (p) differ systematically. The positive (p1-p2) for de-escalation changes means mTPI-2's estimate is higher, triggering caution. The negative (p1-p2) for escalation changes means mTPI-2's estimate is also higher in those cases, but in the context of a higher target, this still warrants escalation. This highlights that algorithm behavior is a function of both its internal model and the external parameters (like target toxicity) set by the trialist.
DECODING INTELLIGENCE...