## Decision Table and Statistical Analysis for mTPI and mTPI-2
### Overview
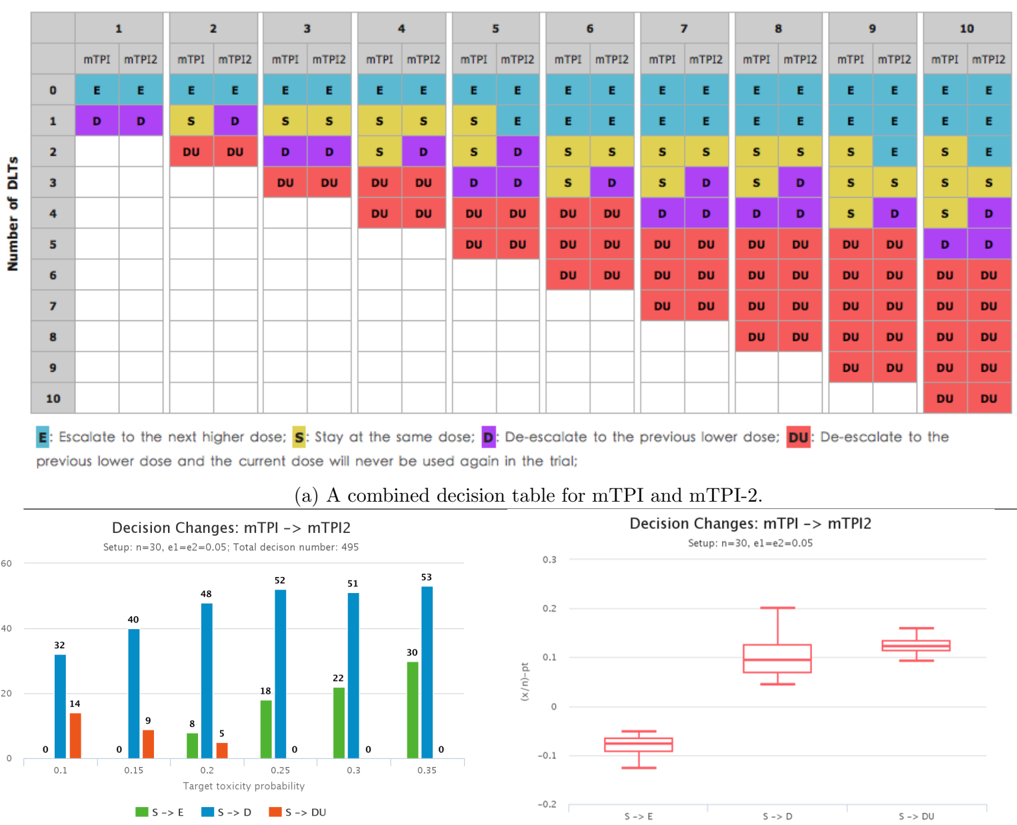
The image contains a combined decision table for mTPI and mTPI-2, two bar charts, and a box plot. The decision table outlines dose escalation/de-escalation rules based on mTPI and mTPI2 values. The bar charts and box plot analyze decision changes under specific trial setups (n=30, e1=e2=0.05).
---
### Components/Axes
#### Decision Table
- **Structure**: 10x10 grid with rows (0–10) representing the number of DLTs and columns (1–10) representing trial stages.
- **Colors**:
- **E (Blue)**: Escalate to the next higher dose.
- **S (Yellow)**: Stay at the same dose.
- **D (Purple)**: De-escalate to the previous lower dose.
- **DU (Red)**: De-escalate to the previous lower dose, and the current dose will never be used again.
- **Legend**: Located at the bottom, with color-coded labels for E, S, D, DU.
- **Footnote**: Explains the meaning of each color in terms of dose adjustments.
#### Bar Charts
1. **First Bar Chart** ("Decision Changes: mTPI -> mTPI2"):
- **X-axis**: Target toxicity probability (0.1, 0.15, 0.2, 0.25, 0.3, 0.35).
- **Y-axis**: Number of decisions (0–60).
- **Bars**:
- **S->E (Green)**: Escalate to next dose.
- **S->D (Blue)**: De-escalate to previous dose.
- **S->DU (Orange)**: De-escalate and discontinue current dose.
- **Total Decisions**: 495.
2. **Second Bar Chart** ("Decision Changes: mTPI -> mTPI2"):
- **X-axis**: Same as above (target toxicity probability).
- **Y-axis**: (x/n)-pt (proportion of decisions, -0.2 to 0.2).
- **Bars**:
- **S->E (Red)**: Escalate to next dose.
- **S->D (Red)**: De-escalate to previous dose.
- **S->DU (Red)**: De-escalate and discontinue current dose.
- **Total Decisions**: 53.
#### Box Plot
- **X-axis**: Decision changes (S->E, S->D, S->DU).
- **Y-axis**: (x/n)-pt (proportion of decisions, -0.2 to 0.2).
- **Bars**: Red boxes represent median and quartiles for each decision change.
---
### Detailed Analysis
#### Decision Table
- **Key Observations**:
- **Escalation (E)**: Dominates early stages (columns 1–3) and lower DLT counts (rows 0–1).
- **De-escalation (D)**: Appears in mid-to-late stages (columns 4–10) and higher DLT counts (rows 2–10).
- **DU (Red)**: Concentrated in late stages (columns 7–10) and high DLT counts (rows 6–10).
- **S (Yellow)**: Appears sporadically, especially in mid-stages (columns 4–6) and mid-DLT counts (rows 3–5).
#### Bar Charts
1. **First Bar Chart**:
- **Trends**:
- **S->D (Blue)**: Highest frequency (53 at 0.35 toxicity probability).
- **S->E (Green)**: Increases from 0 (0.1) to 30 (0.35).
- **S->DU (Orange)**: Decreases from 14 (0.1) to 0 (0.35).
- **Notable**: S->D dominates, suggesting a trend toward de-escalation at higher toxicity probabilities.
2. **Second Bar Chart**:
- **Trends**:
- All bars are red, indicating normalized proportions.
- **S->D** has the highest median (box plot), followed by S->DU and S->E.
- **Notable**: Proportions are smaller than the first chart, suggesting a different scaling or subset of data.
#### Box Plot
- **Trends**:
- **S->D**: Highest median (~0.15) and widest interquartile range.
- **S->E**: Lowest median (~-0.05) and narrowest range.
- **S->DU**: Intermediate median (~0.05) and moderate spread.
- **Notable**: S->D shows the greatest variability in decision changes.
---
### Key Observations
1. **Decision Table**:
- Escalation (E) is most common in early stages and low DLT counts.
- De-escalation (D) and DU (red) become prevalent in later stages and higher DLT counts.
- DU (red) indicates irreversible discontinuation, concentrated in high-risk scenarios.
2. **Bar Charts**:
- **S->D** is the most frequent decision across toxicity probabilities.
- **S->E** increases with toxicity probability, while **S->DU** decreases.
- The second chart’s normalized values (proportions) align with the first chart’s trends but on a smaller scale.
3. **Box Plot**:
- **S->D** has the highest median and variability, indicating it is the most common and variable decision.
- **S->E** and **S->DU** show smaller medians and less variability.
---
### Interpretation
- **Decision Logic**: The table and charts suggest that as toxicity probability increases, the likelihood of de-escalating (D) or discontinuing (DU) rises, reflecting a safety-first approach in trial design.
- **Statistical Significance**: The box plot confirms that S->D decisions are statistically more variable and frequent, while S->E decisions are less common and more consistent.
- **Anomalies**: The absence of DU decisions in the second bar chart (0 at 0.3 and 0.35) may indicate a subset of data or a specific trial condition not reflected in the first chart.
- **Implications**: The data highlights the importance of balancing dose escalation with safety monitoring, as higher toxicity probabilities lead to more conservative decisions.
---
### Spatial Grounding
- **Decision Table**: Top section, grid layout with color-coded cells.
- **Bar Charts**: Bottom-left (first chart) and bottom-right (second chart), with legends and axis labels.
- **Box Plot**: Bottom-center, aligned with the bar charts for comparative analysis.
### Final Notes
The image provides a comprehensive view of decision-making dynamics in a clinical trial, emphasizing the interplay between toxicity probability, DLT counts, and dose adjustments. The statistical tools (bar charts, box plot) reinforce the trends observed in the decision table, offering actionable insights for trial optimization.