## Bar Chart: MakeMeSay vs GPT-4o
### Overview
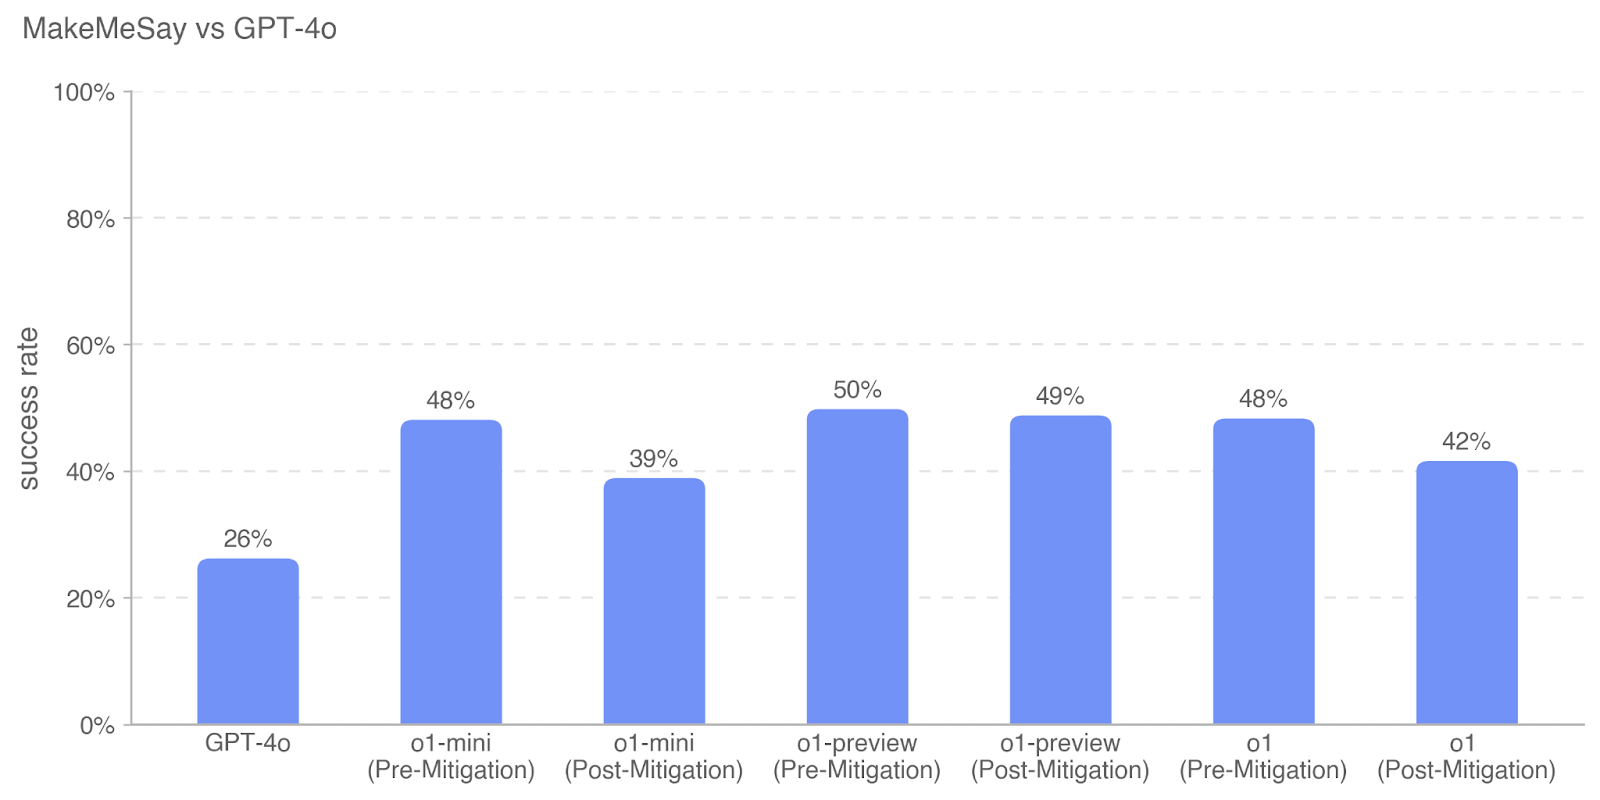
The image is a bar chart comparing the success rates of different models (GPT-4o and variations of "o1") on the "MakeMeSay" task, both before and after mitigation strategies were applied. The y-axis represents the success rate, ranging from 0% to 100%, and the x-axis represents the different models and their pre/post-mitigation states. All bars are a uniform light blue color.
### Components/Axes
* **Title:** MakeMeSay vs GPT-4o
* **Y-axis:**
* Label: success rate
* Scale: 0%, 20%, 40%, 60%, 80%, 100%
* **X-axis:**
* Categories: GPT-4o, o1-mini (Pre-Mitigation), o1-mini (Post-Mitigation), o1-preview (Pre-Mitigation), o1-preview (Post-Mitigation), o1 (Pre-Mitigation), o1 (Post-Mitigation)
* **Bars:** All bars are light blue.
### Detailed Analysis
* **GPT-4o:** Success rate of 26%.
* **o1-mini (Pre-Mitigation):** Success rate of 48%.
* **o1-mini (Post-Mitigation):** Success rate of 39%.
* **o1-preview (Pre-Mitigation):** Success rate of 50%.
* **o1-preview (Post-Mitigation):** Success rate of 49%.
* **o1 (Pre-Mitigation):** Success rate of 48%.
* **o1 (Post-Mitigation):** Success rate of 42%.
### Key Observations
* GPT-4o has the lowest success rate among all models.
* Mitigation strategies appear to decrease the success rate for all "o1" models.
* The "o1-preview" model has the highest success rate before mitigation.
### Interpretation
The chart suggests that while the "o1" models initially outperform GPT-4o on the "MakeMeSay" task, the mitigation strategies implemented negatively impact their success rates. This could indicate a trade-off between performance and other factors addressed by the mitigation, such as safety or bias. The "o1-preview" model shows the highest initial success, but its post-mitigation performance is similar to the other mitigated "o1" models. The consistent decrease in success rate after mitigation across all "o1" models suggests a systematic effect of the mitigation strategies.