## Diagram: GPT-2 Model Development and Performance Comparison
### Overview
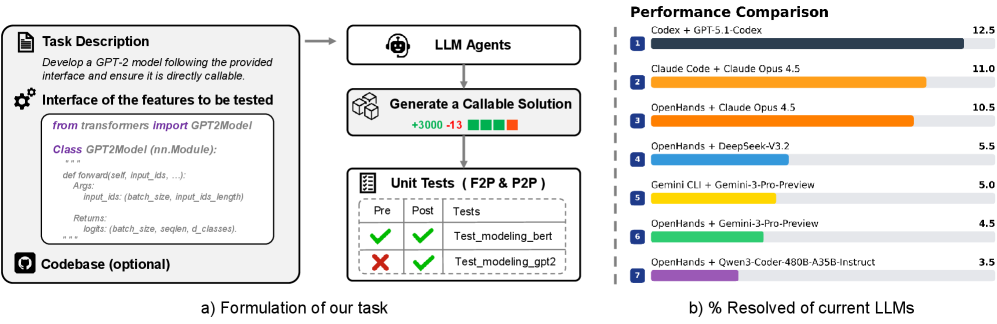
The image presents a technical workflow for developing a GPT-2 model with a callable interface, followed by a performance comparison of various LLM combinations. It includes code structure, testing results, and a bar chart visualizing resolved percentages.
---
### Components/Axes
#### Section a) Formulation of the Task
1. **Task Description**:
- Text: *"Develop a GPT-2 model following the provided interface and ensure it is directly callable."*
2. **Interface of Features to Test**:
- Code snippet:
```python
from transformers import GPT2Model
class GPT2Model(nn.Module):
def forward(self, input_ids, ...):
Args: input_ids (batch_size, input_ids_length)
Returns: logits (batch_size, seq_len, d_classes)
```
- Optional codebase indicated by a lock icon.
3. **LLM Agents**:
- Flow: Generate a callable solution (indicated by a robot head icon).
4. **Unit Tests (F2P & P2P)**:
- Table with columns: Pre, Post, Tests.
- Results:
- ✅ `Test_modeling_bert` (Pre: ✅, Post: ✅)
- ❌ `Test_modeling_gpt2` (Pre: ❌, Post: ✅)
#### Section b) Performance Comparison
1. **Bar Chart**:
- **X-Axis**: LLM combinations (e.g., "Codex + GPT-5.1-Codex", "Claude Code + Opus 4.5").
- **Y-Axis**: "% Resolved of current LLMs" (0–12.5%).
- **Legend**: Right-aligned, colors match bars (e.g., dark blue for Codex + GPT-5.1-Codex).
- **Data Points**:
- 1. Codex + GPT-5.1-Codex: 12.5%
- 2. Claude Code + Opus 4.5: 11.0%
- 3. OpenHands + Opus 4.5: 10.5%
- 4. OpenHands + DeepSeek-V3.2: 5.5%
- 5. Gemini CLI + Gemini-3-Pro-Preview: 5.0%
- 6. OpenHands + Gemini-3-Pro-Preview: 4.5%
- 7. OpenHands + Qwen3-Coder-480B-A35B-Instruct: 3.5%
---
### Detailed Analysis
#### Section a) Formulation of the Task
- The code snippet defines a `GPT2Model` class inheriting from `nn.Module`, with a `forward` method accepting `input_ids` and returning `logits`.
- Unit tests show mixed results: `Test_modeling_bert` passes both pre- and post-tests, while `Test_modeling_gpt2` fails pre-test but passes post-test.
#### Section b) Performance Comparison
- **Trends**:
- The highest performance (12.5%) is achieved by "Codex + GPT-5.1-Codex," followed by Claude-based combinations.
- Performance declines progressively, with the lowest at 3.5% for the Qwen3-Coder combination.
- **Legend Alignment**: Colors in the legend (dark blue, orange, etc.) match the corresponding bars.
---
### Key Observations
1. **Test Results**:
- `Test_modeling_gpt2` fails initially but passes after post-testing, suggesting partial implementation or dependency issues.
2. **Performance Gaps**:
- The top three combinations (Codex, Claude Code, OpenHands + Opus) outperform others by 2–3x.
- The bottom three combinations (DeepSeek, Gemini, Qwen3) show significantly lower efficiency.
---
### Interpretation
- **Technical Workflow**: The task emphasizes creating a modular, testable GPT-2 model with a focus on input/output handling and unit testing.
- **Performance Insights**:
- Codex and Claude-based systems demonstrate superior integration with GPT-2, likely due to optimized interfaces or training data.
- Lower-performing combinations (e.g., Qwen3-Coder) may lack compatibility or require additional tuning.
- **Anomalies**:
- The failure of `Test_modeling_gpt2` pre-test but success post-test warrants investigation into environment setup or dependency resolution.
This analysis highlights the importance of interface design and LLM compatibility in achieving high performance for GPT-2-based solutions.