## Diagram: LLM Performance Comparison
### Overview
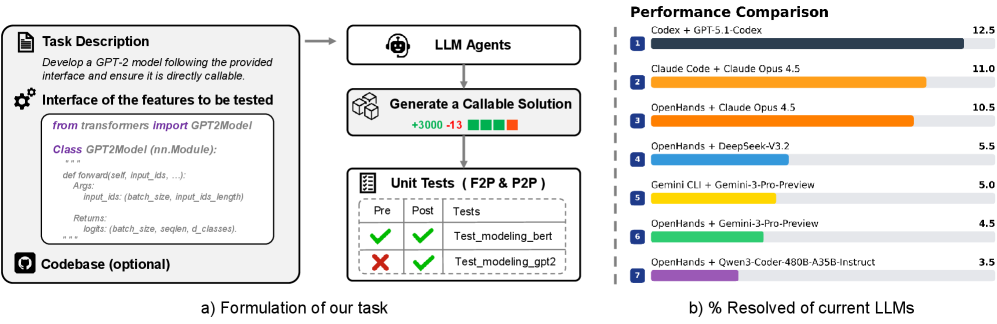
The image presents a diagram illustrating the process of formulating a task for LLM agents and a performance comparison of different LLMs in resolving the task. The diagram is divided into two main sections: the left side describes the task formulation process, and the right side shows a horizontal bar chart comparing the performance of various LLMs.
### Components/Axes
**Left Side (Task Formulation):**
* **Task Description:** A text box outlining the task: "Develop a GPT-2 model following the provided interface and ensure it is directly callable."
* **Interface of the features to be tested:** A code snippet showing the structure of the GPT-2 model using the `transformers` library.
* `from transformers import GPT2Model`
* `Class GPT2Model (nn.Module):`
* `def forward(self, input_ids, ...):`
* `Args:`
* `input_ids: (batch_size, input_ids_length)`
* `Returns:`
* `logits: (batch_size, seqlen, d_classes).`
* **LLM Agents:** A box representing the LLM agents processing the task.
* **Generate a Callable Solution:** A box indicating the generation of a callable solution, with "+3000" above and "-13" below, accompanied by green and red squares respectively.
* **Unit Tests (F2P & P2P):** A table showing the results of unit tests.
| Tests | Pre | Post |
| ------------------ | --------------- | --------------- |
| Test\_modeling\_bert | Green Checkmark | Green Checkmark |
| Test\_modeling\_gpt2 | Red X | Green Checkmark |
* **Codebase (optional):** A label indicating that the codebase is optional.
* **a) Formulation of our task:** A label indicating the section.
**Right Side (Performance Comparison):**
* **Title:** "Performance Comparison"
* **X-axis:** "% Resolved of current LLMs" (Implied scale from 0 to 12.5)
* **Y-axis:** LLM Agents (Categorical, listed vertically)
* **LLM Agents (from top to bottom):**
1. Codex + GPT-5.1-Codex
2. Claude Code + Claude Opus 4.5
3. OpenHands + Claude Opus 4.5
4. OpenHands + DeepSeek-V3.2
5. Gemini CLI + Gemini-3-Pro-Preview
6. OpenHands + Gemini-3-Pro-Preview
7. OpenHands + Qwen3-Coder-480B-A35B-Instruct
* **b) % Resolved of current LLMs:** A label indicating the section.
### Detailed Analysis
**Task Formulation Process:**
The task formulation process starts with a task description, which is then processed by LLM agents to generate a callable solution. The solution is then subjected to unit tests. The number "+3000" and "-13" above and below the "Generate a Callable Solution" box, respectively, likely represent positive and negative changes or metrics associated with the solution generation. The unit tests show that "Test\_modeling\_bert" passed both pre and post tests, while "Test\_modeling\_gpt2" failed the pre-test but passed the post-test.
**Performance Comparison Chart:**
The chart compares the performance of different LLMs in resolving the task. The performance is measured as "% Resolved of current LLMs".
* **Codex + GPT-5.1-Codex:** 12.5% (Dark Blue)
* **Claude Code + Claude Opus 4.5:** 11.0% (Orange)
* **OpenHands + Claude Opus 4.5:** 10.5% (Orange)
* **OpenHands + DeepSeek-V3.2:** 5.5% (Light Blue)
* **Gemini CLI + Gemini-3-Pro-Preview:** 5.0% (Yellow)
* **OpenHands + Gemini-3-Pro-Preview:** 4.5% (Green)
* **OpenHands + Qwen3-Coder-480B-A35B-Instruct:** 3.5% (Purple)
### Key Observations
* The Codex + GPT-5.1-Codex combination has the highest performance, resolving 12.5% of the task.
* The Claude Code + Claude Opus 4.5 and OpenHands + Claude Opus 4.5 combinations perform similarly, resolving 11.0% and 10.5% of the task, respectively.
* The OpenHands + DeepSeek-V3.2 combination has the lowest performance, resolving only 3.5% of the task.
* The unit tests indicate that the LLMs were able to improve the "Test\_modeling\_gpt2" model, as it failed the pre-test but passed the post-test.
### Interpretation
The diagram illustrates the process of developing and testing LLMs for a specific task. The performance comparison chart shows that different LLM combinations have varying levels of success in resolving the task. The Codex + GPT-5.1-Codex combination outperforms the other LLMs, suggesting that it is the most effective for this particular task. The unit tests highlight the importance of testing and refining LLMs to improve their performance. The "+3000" and "-13" values associated with the "Generate a Callable Solution" box could represent the number of successful and unsuccessful attempts, respectively, or other relevant metrics. The diagram provides insights into the development and evaluation of LLMs and can be used to inform the selection of the most appropriate LLM for a given task.