\n
## Diagram: LLM Task Formulation and Performance Comparison
### Overview
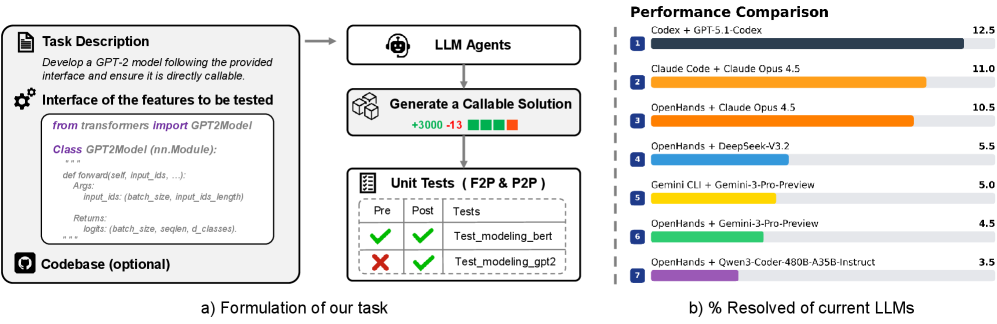
The image presents a diagram illustrating the formulation of a task for Large Language Models (LLMs) and a subsequent performance comparison of several LLMs on that task. The diagram is divided into two main sections: (a) Formulation of our task, which depicts the process of defining and preparing a task for LLMs, and (b) % Resolved of current LLMs, which is a horizontal bar chart comparing the performance of different LLMs.
### Components/Axes
**Section (a) - Formulation of our task:**
* **Task Description:** A document icon with the text "Develop a GPT-2 model following the provided interface and ensure it is directly callable."
* **Interface of the features to be tested:** A gear icon with code snippet: "from transformers import GPT2Model\nClass GPT2Model (nn.Module):\ndef forward(self, input_ids, ...):\nArgs:\ninput_ids (batch_size, input_ids_length)\nReturns:\nlogits (batch_size, seqlen, d_classes)."
* **Codebase (optional):** A database icon.
* **LLM Agents:** A brain icon.
* **Generate a Callable Solution:** A cube icon with "+3000 +13" text.
* **Unit Tests (F2P & P2P):** A checklist icon with "Pre" and "Post" labels. Two checkmarks and two X marks are present, with labels "Test_modeling_gpt2" and "Test_modeling_gpt2".
* Arrows connecting the components, indicating the flow of the process.
**Section (b) - % Resolved of current LLMs:**
* **Title:** "Performance Comparison"
* **X-axis:** "% Resolved" with a scale from 0 to 12.5.
* **Y-axis:** LLM names, numbered 1 to 7.
* **Legend:** Each LLM is represented by a different color bar.
### Detailed Analysis or Content Details
**Section (a) - Formulation of our task:**
The task involves developing a GPT-2 model with a specified interface. The process starts with a task description, followed by defining the interface, optionally utilizing a codebase, invoking LLM agents to generate a callable solution, and finally, validating the solution through unit tests. The "+3000 +13" on the cube icon likely represents a metric related to the generated solution (e.g., lines of code, tokens). The unit tests show a mix of passing and failing tests for "Test_modeling_gpt2".
**Section (b) - % Resolved of current LLMs:**
The horizontal bar chart displays the performance of seven LLMs, measured as the percentage of the task resolved.
1. **Codex + GPT-5.1-Codex:** Approximately 12.5% resolved (Dark Gray).
2. **Claude Code + Claude Opus 4.5:** Approximately 11.0% resolved (Orange).
3. **OpenHands + Claude Opus 4.5:** Approximately 10.5% resolved (Light Orange).
4. **OpenHands + DeepSeek-v2:** Approximately 5.5% resolved (Yellow).
5. **Gemini CLI + Gemini-3-Pro-Preview:** Approximately 5.0% resolved (Light Yellow).
6. **OpenHands + Gemini-3-Pro-Preview:** Approximately 4.5% resolved (Green).
7. **OpenHands + Qwen3-Coder-480B-A35B-Instruct:** Approximately 3.5% resolved (Light Green).
The bars are arranged in descending order of performance, with Codex + GPT-5.1-Codex performing the best and OpenHands + Qwen3-Coder-480B-A35B-Instruct performing the worst.
### Key Observations
* Codex + GPT-5.1-Codex significantly outperforms all other LLMs.
* Claude Code + Claude Opus 4.5 and OpenHands + Claude Opus 4.5 have similar performance levels.
* OpenHands combined with different models (DeepSeek-v2, Gemini-3-Pro-Preview, Qwen3-Coder) shows decreasing performance.
* The performance spread is relatively wide, ranging from 3.5% to 12.5%.
### Interpretation
The diagram illustrates a workflow for evaluating LLMs on a specific task – developing a GPT-2 model. The performance comparison highlights the varying capabilities of different LLMs in this context. The dominance of Codex + GPT-5.1-Codex suggests its superior ability to generate code or understand code-related tasks. The combination of OpenHands with different models demonstrates that the choice of the underlying model significantly impacts performance. The unit test results indicate that the generated solutions are not always perfect, and further refinement may be necessary. The "+3000 +13" metric on the "Generate a Callable Solution" step could be a measure of the complexity or size of the generated code, potentially correlating with performance. The diagram provides a clear visual representation of the task formulation process and a quantitative comparison of LLM performance, enabling informed decision-making regarding LLM selection for code generation tasks.