## Bar Chart: Distribution of Snapshots by Number of Past Actions
### Overview
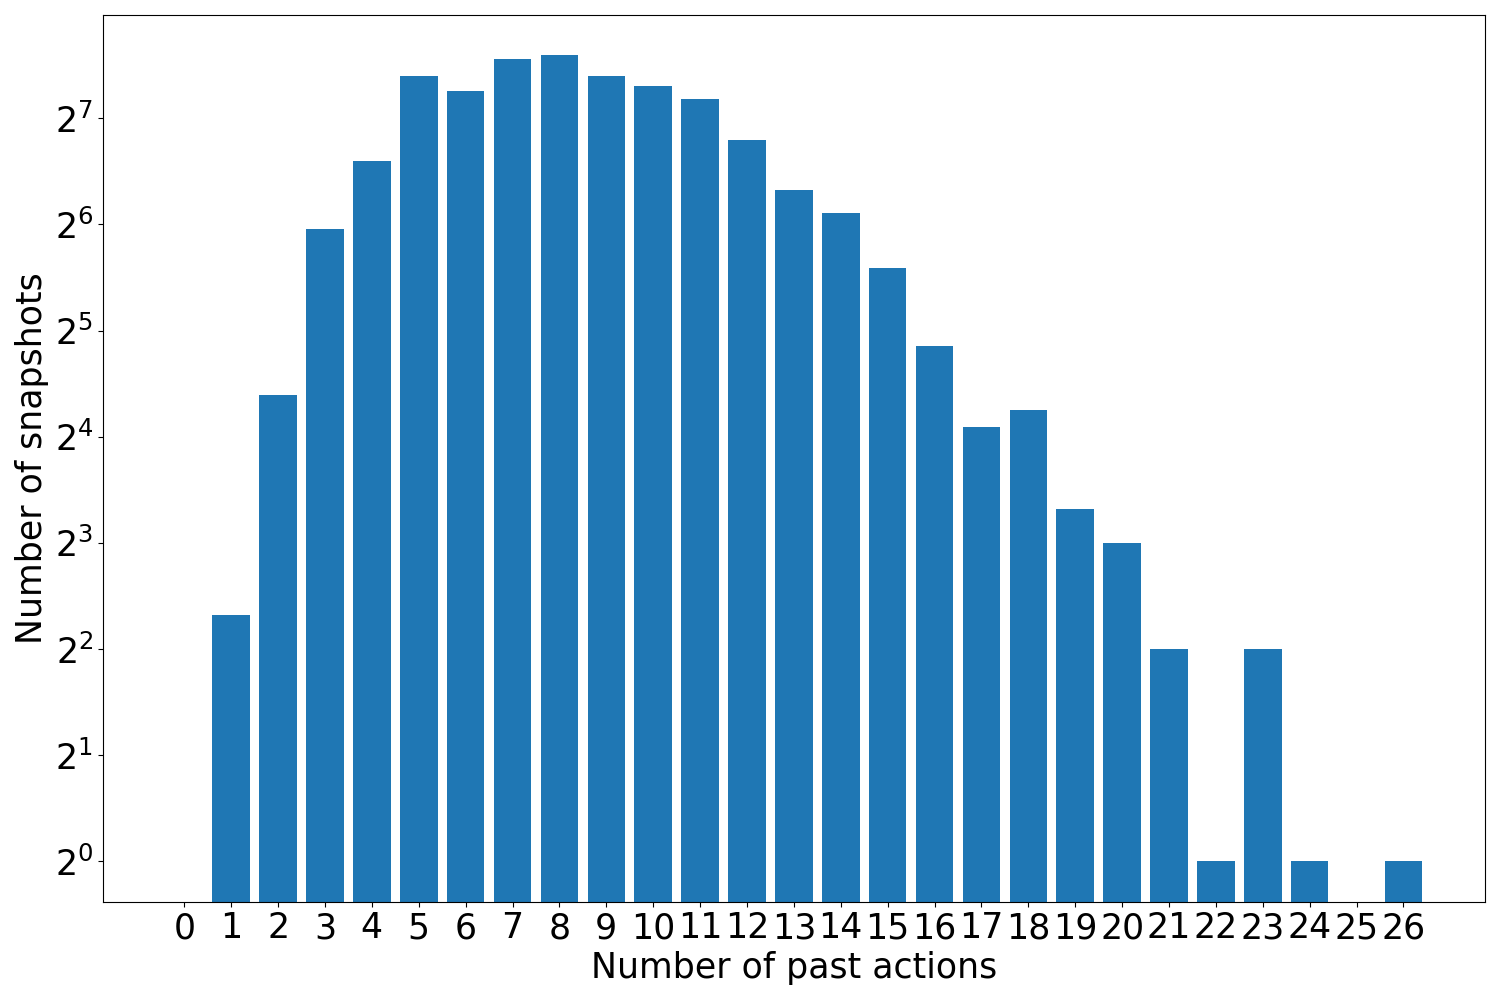
The chart displays a bar graph illustrating the relationship between the number of past actions (x-axis) and the number of snapshots (y-axis). The y-axis uses a logarithmic scale (2⁰ to 2⁷), while the x-axis ranges from 0 to 26. The bars represent the frequency of snapshots for each category of past actions, with the tallest bars clustered around 7–8 past actions.
### Components/Axes
- **X-axis (Horizontal)**: Labeled "Number of past actions," with integer values from 0 to 26.
- **Y-axis (Vertical)**: Labeled "Number of snapshots," using a logarithmic scale (2⁰ = 1, 2¹ = 2, ..., 2⁷ = 128).
- **Bars**: Blue-colored bars represent the frequency of snapshots for each x-axis category. No legend is present, but the color is consistent across all bars.
### Detailed Analysis
- **Distribution**:
- The number of snapshots increases sharply from 0 to 7–8 past actions, peaking at approximately 2⁷ (128 snapshots).
- After the peak, the frequency declines gradually, with fewer snapshots for higher numbers of past actions.
- The distribution forms a "long tail" pattern, with the smallest bars (2⁰ = 1 snapshot) observed at 24–26 past actions.
- **Key Data Points**:
- **0 past actions**: ~2² (4 snapshots).
- **1 past action**: ~2⁴ (16 snapshots).
- **2–3 past actions**: ~2⁵–2⁶ (32–64 snapshots).
- **4–6 past actions**: ~2⁶–2⁷ (64–128 snapshots).
- **7–8 past actions**: Peak at ~2⁷ (128 snapshots).
- **9–15 past actions**: Gradual decline to ~2⁴–2⁵ (16–32 snapshots).
- **16–20 past actions**: Further decline to ~2³–2⁴ (8–16 snapshots).
- **21–23 past actions**: ~2¹–2² (2–4 snapshots).
- **24–26 past actions**: ~2⁰ (1 snapshot each).
### Key Observations
1. **Peak at 7–8 past actions**: The highest frequency of snapshots occurs at this range, suggesting it is the most common category of past actions.
2. **Long tail**: The frequency drops significantly for actions beyond 8, indicating fewer users engage in very high numbers of past actions.
3. **Logarithmic scale impact**: The y-axis compression emphasizes exponential growth in snapshots for lower past actions, while higher values appear less impactful visually.
### Interpretation
The data suggests a distribution where most users have a moderate number of past actions (7–8), with a steep decline in frequency for higher action counts. The logarithmic y-axis highlights the exponential relationship between past actions and snapshots, emphasizing that small increases in past actions (e.g., from 0 to 2) lead to disproportionate increases in snapshots. The long tail implies that while most users cluster around the peak, a small subset engages in significantly more actions, though these are rare. This pattern could reflect user behavior in systems where actions are cumulative (e.g., social media interactions, task completion), with diminishing returns or engagement over time.