## Line Chart: Change in FOM (%) vs. Number of Exact and Recording Repetitions
### Overview
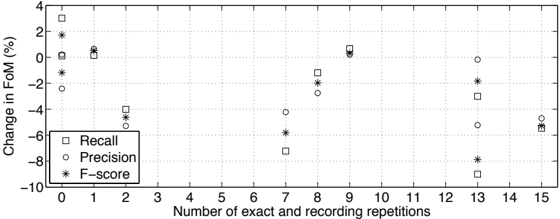
The image is a line chart displaying the relationship between the number of exact and recording repetitions (x-axis) and the percentage change in FOM (y-axis). Three data series are represented: Recall (squares), Precision (circles), and F-score (stars). The chart uses a grid background with dotted lines and a legend in the bottom-left corner.
### Components/Axes
- **X-axis**: "Number of exact and recording repetitions" (integer values from 0 to 15).
- **Y-axis**: "Change in FOM (%)" (ranging from -10% to 4%).
- **Legend**: Located in the bottom-left corner, with symbols:
- **Recall**: Square (□)
- **Precision**: Circle (●)
- **F-score**: Star (★)
### Detailed Analysis
- **Recall (□)**:
- Data points at x = 0, 1, 2, 5, 8, 9, 13, 15.
- Values: ~2% (x=0), ~0% (x=1), ~-4% (x=2), ~0% (x=5), ~2% (x=8), ~-2% (x=9), ~-4% (x=13), ~-6% (x=15).
- **Precision (●)**:
- Data points at x = 0, 1, 2, 5, 7, 8, 9, 13, 15.
- Values: ~-2% (x=0), ~0% (x=1), ~-2% (x=2), ~-4% (x=5), ~-2% (x=7), ~0% (x=8), ~-2% (x=9), ~-4% (x=13), ~-6% (x=15).
- **F-score (★)**:
- Data points at x = 0, 1, 2, 5, 7, 8, 9, 13, 15.
- Values: ~2% (x=0), ~-4% (x=1), ~-6% (x=2), ~-4% (x=5), ~-6% (x=7), ~-4% (x=8), ~-6% (x=9), ~-8% (x=13), ~-6% (x=15).
### Key Observations
1. **General Trend**: All three metrics show a **downward trend** as the number of repetitions increases.
2. **Recall**: Peaks at x=8 (~2%) but declines sharply to ~-6% at x=15.
3. **Precision**: Fluctuates but ends at ~-6% at x=15.
4. **F-score**: Consistently negative, reaching ~-8% at x=13 and recovering slightly to ~-6% at x=15.
5. **Outliers**:
- Recall and Precision show minor recoveries at x=8 (e.g., ~2% for Recall).
- F-score has a sharp drop to ~-8% at x=13.
### Interpretation
The data suggests that increasing the number of exact and recording repetitions correlates with a **decline in performance metrics** (Recall, Precision, F-score). This could indicate **overfitting** or **diminishing returns** in the model being evaluated. The F-score, which balances precision and recall, demonstrates the most significant deterioration, implying that the model's overall effectiveness worsens with higher repetition counts. The minor recoveries observed at certain points (e.g., x=8) may reflect temporary improvements due to specific data characteristics or anomalies. The consistent negative trend across all metrics highlights a critical trade-off between repetition frequency and model performance.