## 2D Contour Plot with Marginal Distributions: Text Domain Embedding Analysis
### Overview
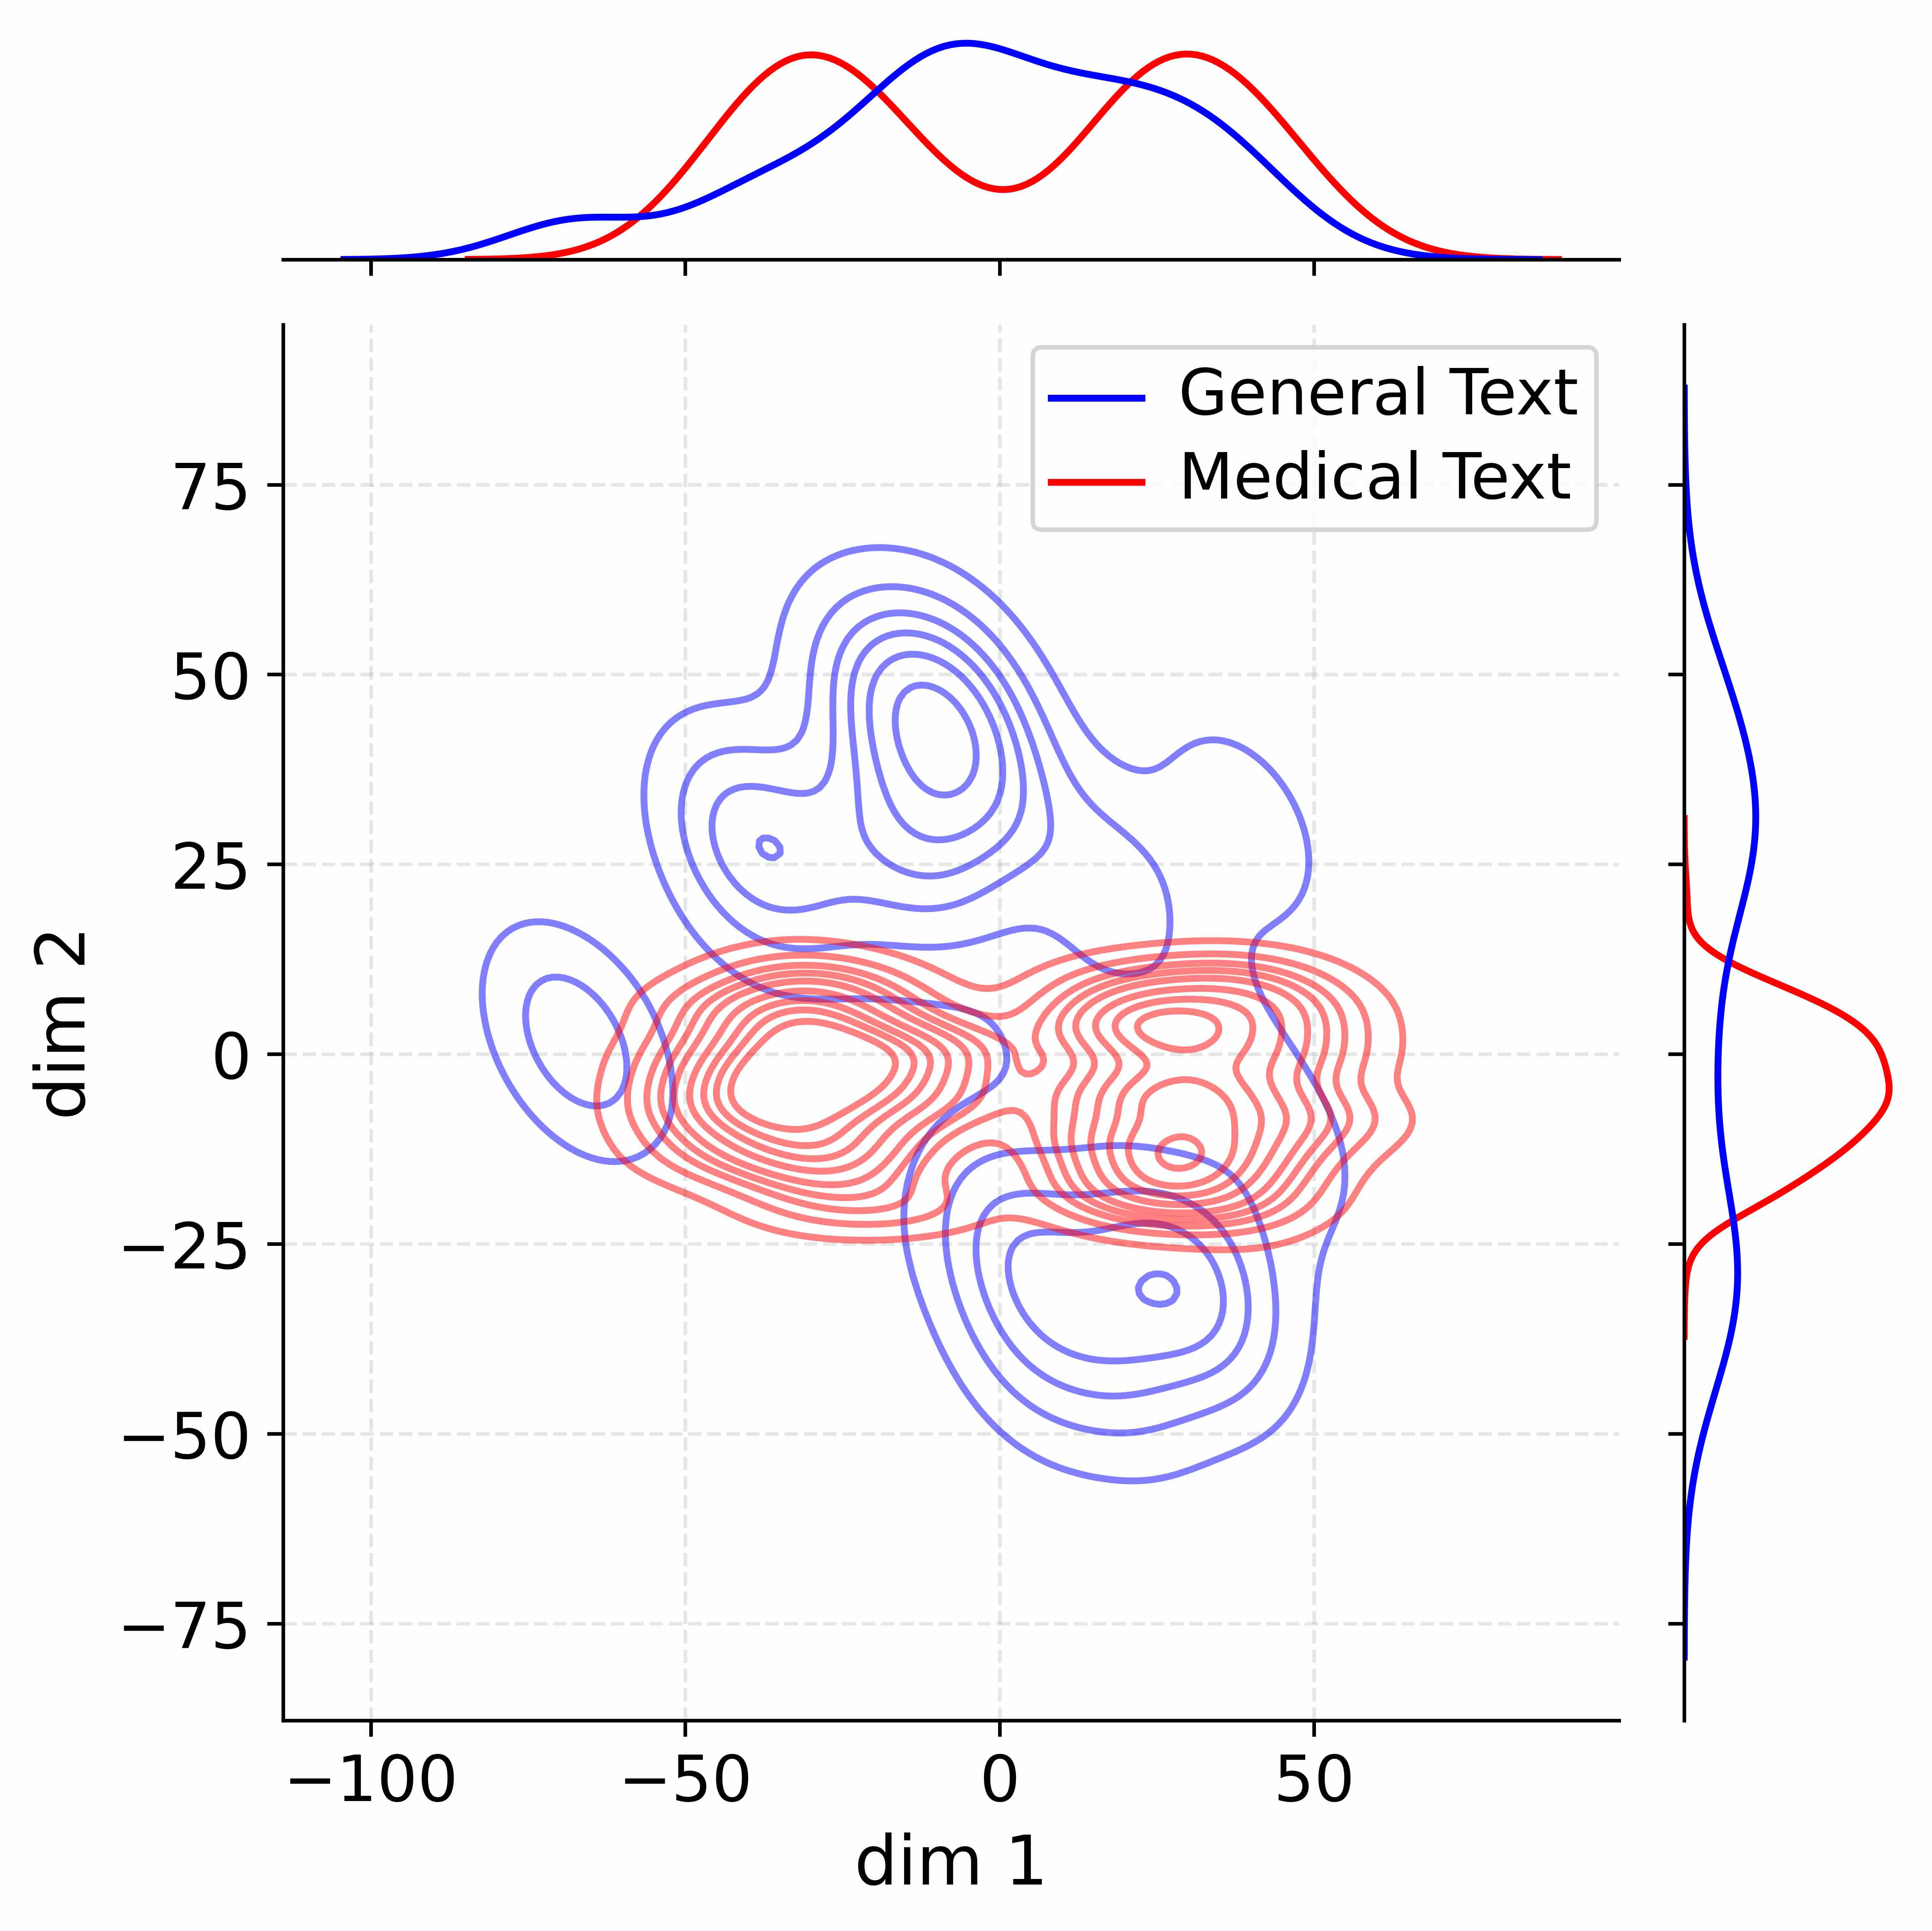
The image displays a 2D contour plot visualizing the distribution of two categories of text data in a two-dimensional embedding space. The plot includes marginal density distributions along the top (for the horizontal axis) and right side (for the vertical axis). The data is separated into "General Text" (blue) and "Medical Text" (red).
### Components/Axes
* **Main Plot (Center):**
* **X-axis (dim 1):** Labeled "dim 1". Ticks are at -100, -50, 0, and 50.
* **Y-axis (dim 2):** Labeled "dim 2". Ticks are at -75, -50, -25, 0, 25, 50, and 75.
* **Legend:** Located in the top-right quadrant of the main plot area. It contains:
* A blue line labeled "General Text".
* A red line labeled "Medical Text".
* **Grid:** A light gray dashed grid is present.
* **Marginal Plot (Top):** Shows the density distribution along "dim 1". The x-axis aligns with the main plot's x-axis. It contains two curves: a blue curve for "General Text" and a red curve for "Medical Text".
* **Marginal Plot (Right):** Shows the density distribution along "dim 2". The y-axis aligns with the main plot's y-axis. It contains two curves: a blue curve for "General Text" and a red curve for "Medical Text".
### Detailed Analysis
**1. Main Contour Plot:**
* **General Text (Blue Contours):**
* **Trend/Shape:** The distribution is bimodal in the vertical dimension (dim 2). It forms two distinct, separate clusters.
* **Cluster 1 (Upper):** Centered approximately at (dim1 ≈ 0, dim2 ≈ 50). This cluster is dense, with many concentric contour lines indicating a high probability density peak.
* **Cluster 2 (Lower):** Centered approximately at (dim1 ≈ 0, dim2 ≈ -30). This cluster is also dense and well-defined.
* **Spatial Relationship:** The two clusters are vertically separated with minimal overlap. They are horizontally centered around dim1=0.
* **Medical Text (Red Contours):**
* **Trend/Shape:** The distribution is more horizontally spread and appears unimodal or possibly bimodal in the horizontal dimension (dim 1), but centered around dim2=0.
* **Primary Mass:** The main body of the distribution is centered around dim2 ≈ 0, spanning from approximately dim1 = -75 to dim1 = 75.
* **Peaks:** There appear to be two density peaks within this mass: one near (dim1 ≈ -25, dim2 ≈ 0) and another near (dim1 ≈ 25, dim2 ≈ 0).
* **Spatial Relationship:** This distribution is largely contained within the vertical band of dim2 between -25 and 25, overlapping the space between the two blue clusters.
**2. Marginal Distributions:**
* **Top Marginal (dim 1):**
* **General Text (Blue):** Shows a single, broad peak centered near dim1 = 0.
* **Medical Text (Red):** Shows a clear bimodal distribution with two distinct peaks. One peak is near dim1 = -25, and the other is near dim1 = 25. The valley between them is near dim1 = 0.
* **Right Marginal (dim 2):**
* **General Text (Blue):** Shows a clear bimodal distribution with two distinct peaks. One peak is near dim2 = 50, and the other is near dim2 = -30. The valley between them is near dim2 = 10.
* **Medical Text (Red):** Shows a single, broad peak centered near dim2 = 0.
### Key Observations
1. **Orthogonal Separation:** The two text domains are separated primarily along the "dim 2" axis. "General Text" occupies extreme positive and negative values of dim2, while "Medical Text" is concentrated around the center (dim2=0).
2. **Complementary Bimodality:** The bimodality is orthogonal between categories. "Medical Text" is bimodal along "dim 1" (horizontal), while "General Text" is bimodal along "dim 2" (vertical).
3. **Overlap Region:** There is a region of overlap in the center of the plot (around dim1=0, dim2=0), where the lower tail of the upper blue cluster, the upper tail of the lower blue cluster, and the main mass of the red distribution intersect.
4. **Density:** The contour lines for both categories are densely packed at their respective peaks, indicating high concentration of data points in those regions of the embedding space.
### Interpretation
This plot likely visualizes the output of a dimensionality reduction technique (like t-SNE or UMAP) applied to text embeddings. The clear separation suggests that the underlying model or feature space effectively distinguishes between general-domain text and domain-specific medical text.
* **What the data suggests:** The distinct, non-overlapping clusters imply that "General Text" and "Medical Text" have fundamentally different statistical properties in this embedding space. The bimodal nature of each could indicate the presence of two major subtypes or topics within each broad category (e.g., general text might split into formal/informal, medical text into clinical/research).
* **How elements relate:** The marginal distributions perfectly corroborate the 2D contours. The top marginal explains the horizontal spread of the red contours and the central concentration of the blue contours. The right marginal explains the vertical separation of the blue clusters and the central concentration of the red cluster.
* **Notable patterns/anomalies:** The most striking pattern is the orthogonal bimodality. It suggests that the primary axis of variation for medical text (dim1) is different from the primary axis of variation for general text (dim2). This could be an artifact of the embedding method or a genuine reflection of the data structure. The central overlap region is also significant, as it may represent text that is ambiguous or hybrid in nature, sharing characteristics of both domains.