## Contour Plot with Marginal Distributions: Text Type Distribution Analysis
### Overview
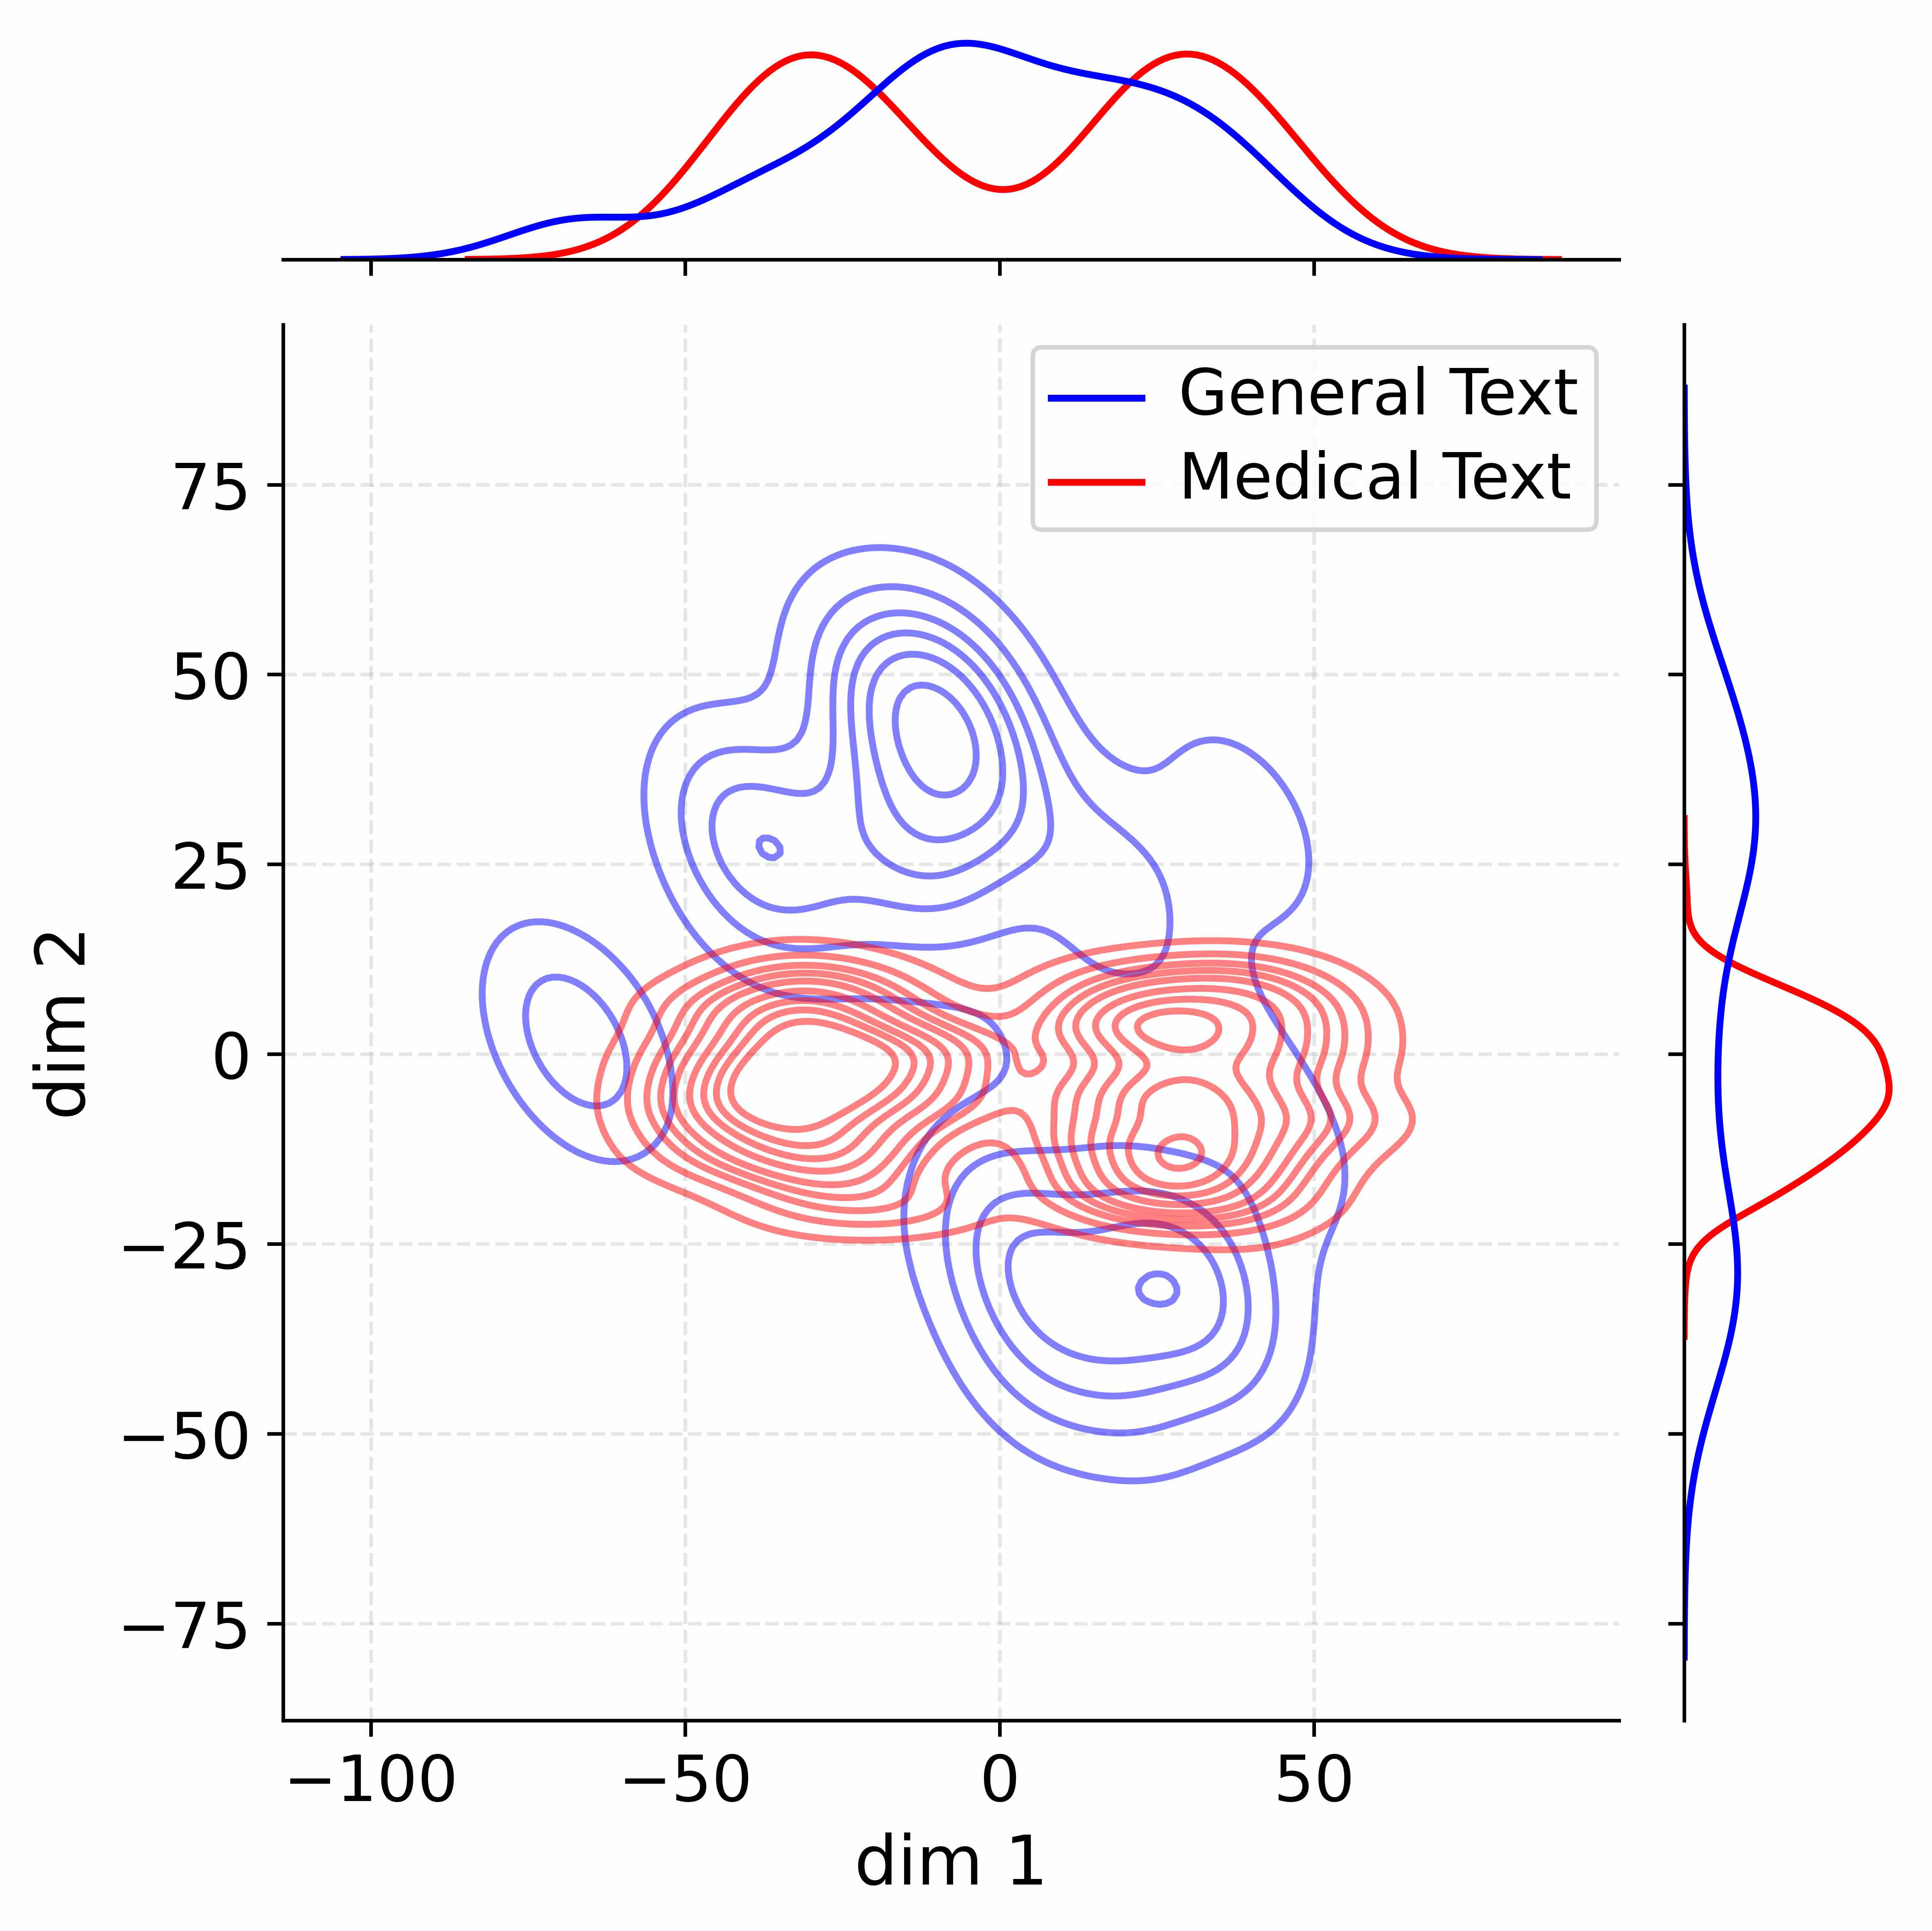
The image presents a 2D contour plot with overlaid marginal distributions, comparing two text types: "General Text" (blue) and "Medical Text" (red). The plot uses dimensionality reduction (dim1 and dim2 axes) to visualize data clustering and distribution patterns.
### Components/Axes
- **Axes**:
- X-axis (dim1): Ranges from -100 to 100
- Y-axis (dim2): Ranges from -75 to 75
- **Legend**:
- Blue: General Text
- Red: Medical Text
- **Marginal Distributions**:
- Top: dim1 distribution (blue/red curves)
- Right: dim2 distribution (blue/red curves)
### Detailed Analysis
1. **Contour Plot**:
- **General Text (Blue)**:
- Concentrated in two primary clusters:
- Cluster 1: Centered near (-30, 10) with tight contour spacing
- Cluster 2: Centered near (20, -20) with moderate contour density
- Outer contours extend to dim1 ≈ ±80 and dim2 ≈ ±60
- **Medical Text (Red)**:
- Dominates the central region (-10 ≤ dim1 ≤ 30, -25 ≤ dim2 ≤ 25)
- Shows a prominent peak near (0, 0) with dense contour lines
- Outer contours reach dim1 ≈ ±60 and dim2 ≈ ±50
2. **Marginal Distributions**:
- **dim1 (Top)**:
- Blue peak at dim1 ≈ -50 (height ≈ 0.03)
- Red peak at dim1 ≈ 0 (height ≈ 0.04)
- Secondary blue peak at dim1 ≈ 50 (height ≈ 0.02)
- **dim2 (Right)**:
- Blue peak at dim2 ≈ 0 (height ≈ 0.035)
- Red peak at dim2 ≈ 0 (height ≈ 0.045)
- Asymmetric tails: Blue extends further negatively (dim2 ≈ -75)
### Key Observations
1. **Overlap Region**:
- Significant overlap between blue and red contours in the central quadrant (-20 ≤ dim1 ≤ 20, -15 ≤ dim2 ≤ 15)
- Suggests shared characteristics between text types in this region
2. **Dimensional Spread**:
- dim1 shows bimodal distribution for General Text vs. unimodal for Medical Text
- dim2 exhibits stronger central concentration for both types
3. **Anomalies**:
- Red Medical Text contours extend further into negative dim2 (-50) than blue General Text
- Blue General Text has a distinct outlier cluster at (-30, 10)
### Interpretation
The plot reveals:
1. **Text Type Separation**:
- Medical Text (red) forms a dense central cluster, suggesting domain-specific linguistic patterns
- General Text (blue) shows two distinct clusters, possibly indicating sub-categories or stylistic variations
2. **Dimensional Relationships**:
- dim1 appears to capture a primary differentiator between text types
- dim2 shows less discriminative power but reveals distribution asymmetry
3. **Practical Implications**:
- The overlap region (-20 ≤ dim1 ≤ 20, -15 ≤ dim2 ≤ 15) represents ambiguous cases where text classification might be challenging
- The Medical Text's central concentration suggests stronger domain-specific signal in this reduced space
4. **Data Quality Considerations**:
- The bimodal distribution in dim1 for General Text may indicate potential data contamination or mixed sources
- The extended negative dim2 tail for General Text warrants investigation for outlier handling