## Line Chart: DeepSeek-R1-Distill-Llama-8B Performance
### Overview
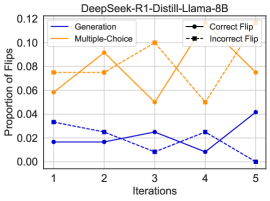
This line chart displays the proportion of flips across different iterations for a model named DeepSeek-R1-Distill-Llama-8B. The chart compares the performance of "Generation", "Multiple-Choice", "Correct Flip", and "Incorrect Flip" methods over 5 iterations. The y-axis represents the "Proportion of Flips", and the x-axis represents "Iterations".
### Components/Axes
* **Title:** DeepSeek-R1-Distill-Llama-8B
* **X-axis Label:** Iterations (Scale: 1, 2, 3, 4, 5)
* **Y-axis Label:** Proportion of Flips (Scale: 0.00, 0.02, 0.04, 0.06, 0.08, 0.10, 0.12)
* **Legend:**
* Generation (Blue solid line)
* Multiple-Choice (Orange solid line)
* Correct Flip (Black solid line with circle markers)
* Incorrect Flip (Black dashed line with square markers)
### Detailed Analysis
* **Generation (Blue Line):** The line starts at approximately 0.018 at iteration 1, dips to around 0.016 at iteration 2, rises to approximately 0.022 at iteration 3, decreases to about 0.019 at iteration 4, and then increases significantly to approximately 0.042 at iteration 5. This line shows a generally increasing trend, with a notable jump in the final iteration.
* **Multiple-Choice (Orange Line):** This line begins at approximately 0.072 at iteration 1, rises to a peak of around 0.094 at iteration 2, drops to approximately 0.062 at iteration 3, increases to about 0.078 at iteration 4, and then rises again to approximately 0.096 at iteration 5. The trend is generally fluctuating, with peaks at iterations 2 and 5.
* **Correct Flip (Black Line with Circles):** The line starts at approximately 0.035 at iteration 1, decreases to around 0.025 at iteration 2, rises slightly to approximately 0.028 at iteration 3, decreases to about 0.022 at iteration 4, and then drops sharply to approximately 0.002 at iteration 5. This line shows a decreasing trend, with a significant drop in the final iteration.
* **Incorrect Flip (Black Dashed Line with Squares):** The line begins at approximately 0.016 at iteration 1, decreases to around 0.014 at iteration 2, rises to approximately 0.018 at iteration 3, decreases to about 0.016 at iteration 4, and then drops to approximately 0.001 at iteration 5. This line also shows a decreasing trend, with a sharp drop in the final iteration.
### Key Observations
* The "Multiple-Choice" method consistently exhibits a higher proportion of flips compared to the other methods.
* Both "Correct Flip" and "Incorrect Flip" show a significant decrease in the proportion of flips at iteration 5.
* The "Generation" method shows a notable increase in the proportion of flips at iteration 5.
* The "Multiple-Choice" method fluctuates more than the other methods.
### Interpretation
The chart suggests that the DeepSeek-R1-Distill-Llama-8B model's performance varies across different methods and iterations. The consistently higher proportion of flips for "Multiple-Choice" might indicate that this method is more sensitive to changes or perturbations in the input. The decreasing trend in "Correct Flip" and "Incorrect Flip" at iteration 5 could suggest that the model is becoming more stable or confident in its predictions, reducing the need for flips. The increase in "Generation" at iteration 5 could indicate that the model is exploring more diverse or complex outputs. The fluctuations in "Multiple-Choice" could be due to the inherent variability in the multiple-choice task or the model's sensitivity to different question formulations. The data suggests that the model's behavior is evolving over iterations, with different methods exhibiting different patterns of change. The sharp drops in "Correct Flip" and "Incorrect Flip" at iteration 5 warrant further investigation to understand the underlying cause.