## Line Chart: DeepSeek-R1-Distill-Llama-8B Performance Metrics
### Overview
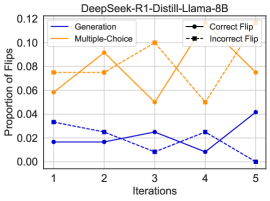
The image is a line chart displaying the performance of a model named "DeepSeek-R1-Distill-Llama-8B" over five training or evaluation iterations. It tracks four distinct metrics related to the model's behavior, specifically concerning "flips" (likely changes in output or decisions). The chart uses two primary colors (blue and orange) and two line styles (solid and dashed) to differentiate the data series.
### Components/Axes
* **Chart Title:** "DeepSeek-R1-Distill-Llama-8B" (centered at the top).
* **X-Axis:** Labeled "Iterations". It has five discrete, equally spaced tick marks labeled 1, 2, 3, 4, and 5.
* **Y-Axis:** Labeled "Proportion of flips". The scale is linear, ranging from 0.00 to 0.12, with major tick marks at intervals of 0.02 (0.00, 0.02, 0.04, 0.06, 0.08, 0.10, 0.12).
* **Legend:** Positioned in the top-right corner of the plot area. It contains four entries:
1. **Generation:** Solid blue line.
2. **Multiple-Choice:** Solid orange line.
3. **Correct Flip:** Dashed blue line with circular markers.
4. **Incorrect Flip:** Dashed orange line with square markers.
### Detailed Analysis
The following data points are approximate values extracted by visually aligning each line's position with the y-axis scale.
**1. Generation (Solid Blue Line)**
* **Trend:** The line shows a fluctuating but overall upward trend. It starts low, dips slightly, then rises to its highest point at the final iteration.
* **Data Points:**
* Iteration 1: ~0.015
* Iteration 2: ~0.015
* Iteration 3: ~0.025
* Iteration 4: ~0.010
* Iteration 5: ~0.045
**2. Multiple-Choice (Solid Orange Line)**
* **Trend:** This line exhibits high variability. It rises to a peak at iteration 3, experiences a sharp drop at iteration 4, and then recends partially at iteration 5.
* **Data Points:**
* Iteration 1: ~0.075
* Iteration 2: ~0.085
* Iteration 3: ~0.100
* Iteration 4: ~0.045
* Iteration 5: ~0.080
**3. Correct Flip (Dashed Blue Line with Circles)**
* **Trend:** This series shows a general downward trend over the five iterations, with a minor recovery at iteration 4 before falling to its lowest point.
* **Data Points:**
* Iteration 1: ~0.035
* Iteration 2: ~0.025
* Iteration 3: ~0.010
* Iteration 4: ~0.025
* Iteration 5: ~0.005
**4. Incorrect Flip (Dashed Orange Line with Squares)**
* **Trend:** The trend for this metric closely mirrors the "Multiple-Choice" line. It rises to a peak at iteration 3, drops sharply at iteration 4, and rises again at iteration 5.
* **Data Points:**
* Iteration 1: ~0.055
* Iteration 2: ~0.070
* Iteration 3: ~0.100
* Iteration 4: ~0.045
* Iteration 5: ~0.080
### Key Observations
1. **Strong Correlation:** The "Multiple-Choice" (solid orange) and "Incorrect Flip" (dashed orange) lines are nearly identical in value and shape across all iterations. This suggests that the proportion of flips in the multiple-choice task is almost entirely composed of incorrect flips.
2. **Divergent Paths:** The "Generation" (solid blue) and "Correct Flip" (dashed blue) lines move in opposite directions. As the proportion of flips in generation tasks increases over time, the proportion of correct flips decreases.
3. **Significant Event at Iteration 4:** There is a pronounced dip in the "Multiple-Choice" and "Incorrect Flip" metrics at iteration 4, where both drop to approximately 0.045. This is the only point where the "Generation" metric (~0.010) is lower than the "Multiple-Choice" metric.
4. **Final State:** By iteration 5, the "Generation" flip proportion (~0.045) is at its highest, while the "Correct Flip" proportion (~0.005) is at its lowest. The "Multiple-Choice" and "Incorrect Flip" proportions have rebounded to ~0.080.
### Interpretation
This chart likely visualizes the behavior of a language model during a reinforcement learning or iterative fine-tuning process. "Flips" probably refer to instances where the model changes its initial output or answer.
* **Task-Specific Behavior:** The model behaves very differently between "Generation" (open-ended text generation) and "Multiple-Choice" tasks. The high and correlated values for "Multiple-Choice" and "Incorrect Flip" indicate that when the model changes its answer in a multiple-choice setting, it is almost always changing from a correct to an incorrect answer. This could signal instability or over-correction in that task format.
* **Learning Dynamics:** The decreasing trend in "Correct Flip" suggests the model is becoming less likely to make beneficial self-corrections over time. Conversely, the rising "Generation" flip proportion might indicate increasing exploration or volatility in its generative outputs.
* **The Iteration 4 Anomaly:** The sharp, synchronized drop in multiple-choice flips at iteration 4 is a critical event. It could represent a change in training parameters, a data batch effect, or a point where the model temporarily stabilized its multiple-choice responses before diverging again. Investigating what occurred at this iteration would be key to understanding the training process.
* **Overall Implication:** The data suggests the model's refinement process is not uniformly improving all metrics. While it may be generating more varied outputs (higher generation flips), its ability to make correct self-assessments, particularly in structured tasks like multiple-choice, is deteriorating. This highlights a potential trade-off or misalignment in the optimization objective.