## Line Chart: DeepSeek-R1-Distill-Llama-8B
### Overview
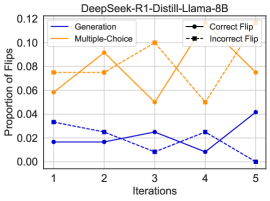
The chart compares the proportion of "Flips" (likely model output changes) across two methods ("Generation" and "Multiple-Choice") over 5 iterations. It includes annotations for "Correct Flip" and "Incorrect Flip" markers, though their exact placement is ambiguous.
### Components/Axes
- **X-axis**: "Iterations" (1 to 5, discrete steps).
- **Y-axis**: "Proportion of Flips" (0.00 to 0.12, linear scale).
- **Legend**:
- **Generation**: Blue dashed line.
- **Multiple-Choice**: Orange solid line.
- **Correct Flip**: Black dot (unclear placement).
- **Incorrect Flip**: Black square (unclear placement).
- **Title**: Positioned at the top-center.
### Detailed Analysis
1. **Generation (Blue Dashed Line)**:
- Iteration 1: ~0.03.
- Iteration 2: ~0.02.
- Iteration 3: ~0.02.
- Iteration 4: ~0.02.
- Iteration 5: ~0.04.
- **Trend**: Starts at 0.03, drops to 0.02 (Iterations 2–4), then rises to 0.04.
2. **Multiple-Choice (Orange Solid Line)**:
- Iteration 1: ~0.06.
- Iteration 2: ~0.08.
- Iteration 3: ~0.10.
- Iteration 4: ~0.05.
- Iteration 5: ~0.07.
- **Trend**: Peaks at 0.10 (Iteration 3), then fluctuates downward and upward.
3. **Correct Flip/Incorrect Flip**:
- No clear data points visible on the chart. Likely annotations or legend entries without direct graphical representation.
### Key Observations
- **Multiple-Choice** consistently shows higher flip proportions than **Generation**, except in Iteration 5 where they converge (~0.07 vs. ~0.04).
- **Generation** exhibits stability until Iteration 5, where it sharply increases.
- **Correct Flip/Incorrect Flip** markers are not visually represented on the chart, suggesting potential ambiguity in their role.
### Interpretation
- The **Multiple-Choice** method demonstrates greater variability in flip proportions, peaking at Iteration 3, which may indicate higher sensitivity to input perturbations or model uncertainty during that phase.
- The **Generation** method shows resilience until Iteration 5, where a sudden increase suggests potential instability or adaptation to later-stage data.
- The absence of visible **Correct Flip/Incorrect Flip** markers on the chart raises questions about their implementation or relevance to the plotted data. This could imply:
- They are theoretical annotations not tied to specific iterations.
- They represent aggregated metrics outside the iteration framework.
- A design oversight in the chart's visualization.
The data suggests that **Multiple-Choice** may be more prone to output flips (potentially errors or corrections) compared to **Generation**, though the final iteration's convergence warrants further investigation into model behavior under stress or complex inputs.