## Bar Chart: Model Performance on CIFAR-100 Dataset
### Overview
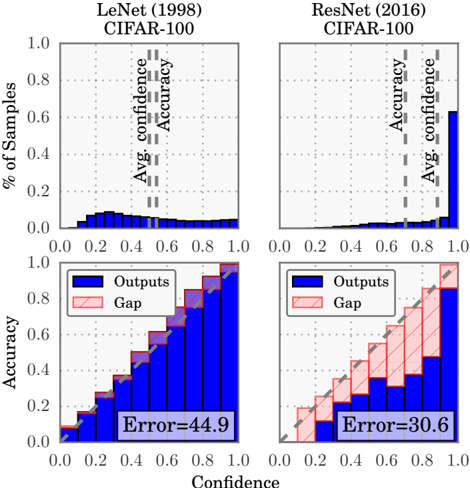
The image contains two side-by-side bar charts comparing the performance of two neural network architectures (LeNet 1998 and ResNet 2016) on the CIFAR-100 dataset. Each chart has two subplots: (1) Accuracy vs. Confidence distribution, and (2) Output-Gap distribution with error metrics. The charts use stacked bars to show the relationship between model confidence and accuracy, with color-coded legends for "Outputs" (blue) and "Gap" (pink).
### Components/Axes
- **X-axis (Confidence)**: Labeled "Confidence" with ticks at 0.0, 0.2, 0.4, 0.6, 0.8, 1.0
- **Y-axis (Left)**: Labeled "% of Samples" for the top subplots, "Accuracy" for the bottom subplots
- **Y-axis (Right)**: Implied scale for gap values (not explicitly labeled)
- **Legends**:
- Blue = "Outputs"
- Pink = "Gap"
- **Annotations**:
- "Avg. confidence" (dashed vertical line)
- "Avg. accuracy" (dashed horizontal line)
- Error percentages: "Error=44.9" (LeNet), "Error=30.6" (ResNet)
### Detailed Analysis
#### LeNet (1998) Chart
- **Accuracy vs. Confidence**:
- Blue bars (Outputs) show increasing accuracy with confidence, peaking near 1.0 confidence.
- Pink bars (Gap) remain minimal across confidence levels.
- Average confidence ≈ 0.7 (dashed line), average accuracy ≈ 0.85 (dashed line).
- **Output-Gap Distribution**:
- Error=44.9% (text annotation at bottom).
- Pink bars dominate at lower confidence levels (<0.4), shrinking as confidence increases.
#### ResNet (2016) Chart
- **Accuracy vs. Confidence**:
- Blue bars (Outputs) show near-perfect accuracy (>0.95) at confidence >0.6.
- Pink bars (Gap) are negligible across all confidence levels.
- Average confidence ≈ 0.85 (dashed line), average accuracy ≈ 0.95 (dashed line).
- **Output-Gap Distribution**:
- Error=30.6% (text annotation at bottom).
- Pink bars are minimal even at low confidence levels (<0.2).
### Key Observations
1. **Model Performance**:
- ResNet achieves significantly higher accuracy (≈95%) compared to LeNet (≈85%) at high confidence levels.
- ResNet maintains low error (30.6%) vs. LeNet's 44.9%, indicating better calibration.
2. **Confidence-Accuracy Relationship**:
- Both models show positive correlation between confidence and accuracy.
- ResNet's accuracy plateaus near 1.0 at confidence >0.8, while LeNet plateaus near 0.9.
3. **Output-Gap Behavior**:
- LeNet exhibits larger gaps at low confidence levels (<0.4), suggesting poor calibration.
- ResNet's gaps remain consistently small across all confidence levels.
### Interpretation
The data demonstrates ResNet's superior performance on CIFAR-100 compared to LeNet. ResNet's lower error percentage (30.6% vs. 44.9%) indicates better alignment between model confidence and actual accuracy, particularly at high confidence thresholds. The minimal gap between "Outputs" and "Gap" in ResNet suggests more reliable predictions, while LeNet's larger gaps at low confidence levels highlight potential overconfidence in uncertain regions. These results align with ResNet's architectural advantages (e.g., residual connections) enabling deeper networks to learn more robust features for complex datasets like CIFAR-100.