## Grouped Bar Chart: Prediction Flip Rate by Dataset and Anchoring Method
### Overview
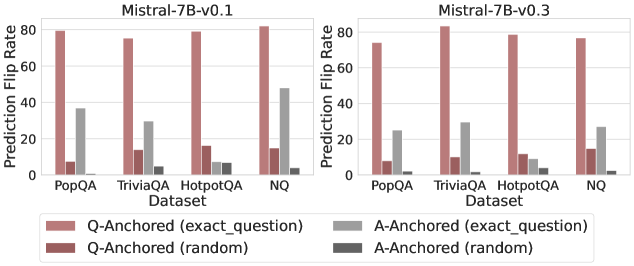
The image displays two side-by-side grouped bar charts comparing the "Prediction Flip Rate" of two language model versions (Mistral-7B-v0.1 and Mistral-7B-v0.3) across four question-answering datasets. The charts analyze how model predictions change ("flip") under different experimental conditions involving question and answer anchoring.
### Components/Axes
* **Chart Titles (Top Center):**
* Left Chart: `Mistral-7B-v0.1`
* Right Chart: `Mistral-7B-v0.3`
* **Y-Axis (Left Vertical):**
* Label: `Prediction Flip Rate`
* Scale: Linear, from 0 to 80, with major tick marks at 0, 20, 40, 60, 80.
* **X-Axis (Bottom Horizontal):**
* Label: `Dataset`
* Categories (from left to right for each chart): `PopQA`, `TriviaQA`, `HotpotQA`, `NQ`.
* **Legend (Bottom Center, spanning both charts):**
* **Position:** Below the x-axis labels.
* **Categories (with color/pattern key):**
1. `Q-Anchored (exact_question)`: Solid, medium reddish-brown bar.
2. `Q-Anchored (random)`: Solid, darker reddish-brown bar.
3. `A-Anchored (exact_question)`: Solid, medium grey bar.
4. `A-Anchored (random)`: Solid, dark grey bar.
### Detailed Analysis
**Chart 1: Mistral-7B-v0.1 (Left)**
| Dataset | Q-Anchored (exact_question) | Q-Anchored (random) | A-Anchored (exact_question) | A-Anchored (random) |
|-----------|-----------------------------|---------------------|-----------------------------|---------------------|
| PopQA | ~80 | ~8 | ~37 | ~1 |
| TriviaQA | ~76 | ~14 | ~30 | ~5 |
| HotpotQA | ~80 | ~17 | ~7 | ~7 |
| NQ | ~82 | ~15 | ~48 | ~3 |
**Chart 2: Mistral-7B-v0.3 (Right)**
| Dataset | Q-Anchored (exact_question) | Q-Anchored (random) | A-Anchored (exact_question) | A-Anchored (random) |
|-----------|-----------------------------|---------------------|-----------------------------|---------------------|
| PopQA | ~74 | ~8 | ~25 | ~1 |
| TriviaQA | ~82 | ~10 | ~30 | ~1 |
| HotpotQA | ~79 | ~11 | ~8 | ~5 |
| NQ | ~77 | ~15 | ~27 | ~1 |
### Key Observations
1. **Dominant Series:** The `Q-Anchored (exact_question)` condition (medium reddish-brown bar) consistently yields the highest Prediction Flip Rate across all datasets and both model versions, typically ranging between 74 and 82.
2. **Minimal Impact Series:** The `A-Anchored (random)` condition (dark grey bar) consistently results in the lowest flip rates, often near zero (1-7).
3. **Dataset Variation:** The `A-Anchored (exact_question)` condition (medium grey bar) shows significant variation by dataset. It is relatively high for PopQA and NQ (especially in v0.1) but very low for HotpotQA.
4. **Model Version Comparison:** The overall pattern is similar between v0.1 and v0.3. A notable difference is the `A-Anchored (exact_question)` rate for the NQ dataset, which drops from ~48 in v0.1 to ~27 in v0.3.
### Interpretation
This data investigates the sensitivity of the Mistral-7B model's predictions to different types of perturbations. The "Prediction Flip Rate" likely measures how often a model changes its answer when presented with a modified version of the original query or context.
* **High Sensitivity to Exact Question Rephrasing:** The extremely high flip rates for `Q-Anchored (exact_question)` suggest that when the model's prediction is "anchored" to a specific question, even rephrasing that same question (while keeping the answer constant) causes the model to change its answer a large majority of the time. This indicates a potential lack of robustness or consistency in the model's reasoning process based on question phrasing.
* **Low Sensitivity to Random Answer Anchoring:** The near-zero flip rates for `A-Anchored (random)` indicate that if the model's prediction is anchored to a random answer, changing the question has almost no effect. This is a logical control, showing the flip rate isn't high simply due to randomness.
* **Dataset-Dependent Answer Anchoring:** The variable performance of `A-Anchored (exact_question)` is insightful. For datasets like PopQA and NQ, anchoring to the exact answer makes the model moderately sensitive to question changes (flip rates of 25-48). However, for HotpotQA, this effect is minimal (~7-8). This could reflect differences in dataset nature—HotpotQA may involve more complex, multi-hop reasoning where the answer itself is a stronger anchor, making the model less likely to flip even if the question is altered.
* **Model Evolution:** The decrease in flip rate for `A-Anchored (exact_question)` on NQ from v0.1 to v0.3 might suggest an improvement in the model's ability to maintain a consistent answer when anchored to it, despite question variations, for that specific dataset.
**In summary, the charts reveal that the model's predictions are highly volatile when anchored to a question and then the question is rephrased, but stable when anchored to a random answer. The influence of anchoring to the *correct* answer is dataset-specific, highlighting that the model's robustness is not uniform across different types of knowledge or reasoning tasks.**