## Bar Chart: Prediction Flip Rate Comparison for Mistral-7B-v0.1 and v0.3
### Overview
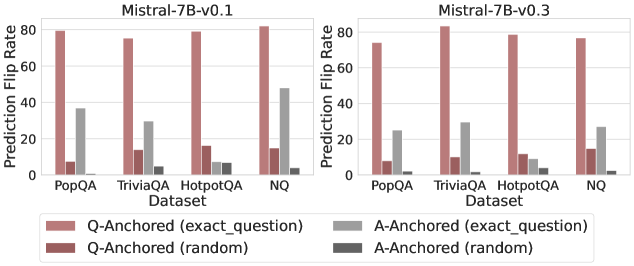
The image contains two side-by-side bar charts comparing prediction flip rates across four datasets (PopQA, TriviaQA, HotpotQA, NQ) for two versions of the Mistral-7B model (v0.1 and v0.3). Each chart uses color-coded bars to represent four anchoring methods: Q-Anchored (exact_question), Q-Anchored (random), A-Anchored (exact_question), and A-Anchored (random). The y-axis measures prediction flip rate (0–80), while the x-axis lists datasets.
### Components/Axes
- **X-Axis (Datasets)**: PopQA, TriviaQA, HotpotQA, NQ (left to right).
- **Y-Axis (Prediction Flip Rate)**: Scale from 0 to 80.
- **Legend**: Located at the bottom, with four color-coded categories:
- Pink: Q-Anchored (exact_question)
- Dark Red: Q-Anchored (random)
- Gray: A-Anchored (exact_question)
- Dark Gray: A-Anchored (random)
### Detailed Analysis
#### Mistral-7B-v0.1
- **PopQA**:
- Q-Anchored (exact_question): ~80
- Q-Anchored (random): ~5
- A-Anchored (exact_question): ~35
- A-Anchored (random): ~1
- **TriviaQA**:
- Q-Anchored (exact_question): ~75
- Q-Anchored (random): ~10
- A-Anchored (exact_question): ~25
- A-Anchored (random): ~3
- **HotpotQA**:
- Q-Anchored (exact_question): ~80
- Q-Anchored (random): ~12
- A-Anchored (exact_question): ~5
- A-Anchored (random): ~4
- **NQ**:
- Q-Anchored (exact_question): ~78
- Q-Anchored (random): ~8
- A-Anchored (exact_question): ~45
- A-Anchored (random): ~2
#### Mistral-7B-v0.3
- **PopQA**:
- Q-Anchored (exact_question): ~70
- Q-Anchored (random): ~7
- A-Anchored (exact_question): ~20
- A-Anchored (random): ~1
- **TriviaQA**:
- Q-Anchored (exact_question): ~80
- Q-Anchored (random): ~8
- A-Anchored (exact_question): ~25
- A-Anchored (random): ~2
- **HotpotQA**:
- Q-Anchored (exact_question): ~75
- Q-Anchored (random): ~10
- A-Anchored (exact_question): ~10
- A-Anchored (random): ~3
- **NQ**:
- Q-Anchored (exact_question): ~75
- Q-Anchored (random): ~9
- A-Anchored (exact_question): ~25
- A-Anchored (random): ~2
### Key Observations
1. **Dominance of Q-Anchored (exact_question)**: Across all datasets and versions, Q-Anchored (exact_question) consistently shows the highest prediction flip rates, often exceeding 70–80.
2. **Random Anchoring Performance**: Q-Anchored (random) and A-Anchored (random) methods have the lowest flip rates, typically below 10.
3. **Version Comparison**: v0.3 generally exhibits lower flip rates than v0.1 for most anchoring methods, suggesting potential improvements in model stability or accuracy.
4. **NQ Dataset Anomaly**: In v0.1, A-Anchored (exact_question) for NQ reaches ~45, the highest among A-Anchored methods. In v0.3, TriviaQA’s Q-Anchored (exact_question) peaks at ~80.
### Interpretation
The data indicates that anchoring methods significantly impact prediction flip rates. Exact question anchoring (Q-Anchored and A-Anchored) correlates with higher flip rates, implying greater sensitivity to input specificity. Random anchoring methods yield minimal flip rates, suggesting robustness to input variations. The reduction in flip rates from v0.1 to v0.3 may reflect model optimizations, though the exact meaning of "prediction flip rate" (e.g., error rate vs. confidence metric) would clarify whether lower values are beneficial. Notably, the NQ dataset in v0.1 shows a unique pattern where A-Anchored (exact_question) outperforms other methods, warranting further investigation into dataset-specific model behavior.