## Chart/Diagram Type: Performance and Latency Analysis
### Overview
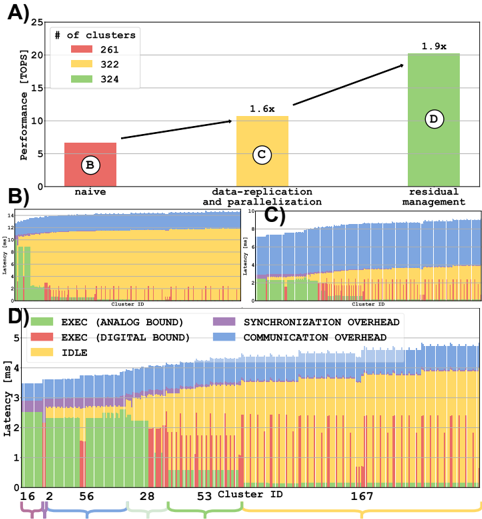
The image presents a multi-part figure analyzing the performance and latency of different computational strategies. Part A is a bar chart comparing the performance (in TOPS) of "naive", "data-replication and parallelization", and "residual management" approaches, categorized by the number of clusters (261, 322, and 324). Parts B, C, and D are stacked bar charts showing latency breakdowns for different cluster IDs, with latency components including "EXEC (ANALOG BOUND)", "EXEC (DIGITAL BOUND)", "IDLE", "SYNCHRONIZATION OVERHEAD", and "COMMUNICATION OVERHEAD".
### Components/Axes
**Part A: Performance Bar Chart**
* **Y-axis:** Performance [TOPS], with a scale from 0 to 25.
* **X-axis:** Categorical, representing three approaches: "naive", "data-replication and parallelization", and "residual management".
* **Legend (Top-Left):**
* Red: # of clusters 261
* Yellow: # of clusters 322
* Green: # of clusters 324
**Parts B, C, and D: Latency Stacked Bar Charts**
* **Y-axis:** Latency [ms], with a scale from 0 to 14 in B, 0 to 10 in C, and 0 to 5 in D.
* **X-axis:** Cluster ID (discrete values).
* **Legend (Part D, Bottom):**
* Green: EXEC (ANALOG BOUND)
* Red: EXEC (DIGITAL BOUND)
* Yellow: IDLE
* Purple: SYNCHRONIZATION OVERHEAD
* Blue: COMMUNICATION OVERHEAD
### Detailed Analysis
**Part A: Performance Bar Chart**
* **Naive (Red, 261 clusters):** Performance is approximately 6.5 TOPS.
* **Data-replication and parallelization (Yellow, 322 clusters):** Performance is approximately 10.5 TOPS. An arrow indicates a 1.6x improvement over the "naive" approach.
* **Residual management (Green, 324 clusters):** Performance is approximately 19.5 TOPS. An arrow indicates a 1.9x improvement over the "data-replication and parallelization" approach.
**Part B: Latency Stacked Bar Chart (Cluster ID unspecified)**
* The chart shows latency breakdown for a series of cluster IDs.
* "IDLE" (Yellow) dominates the latency for most clusters, reaching up to approximately 12 ms.
* "COMMUNICATION OVERHEAD" (Blue) increases with cluster ID, reaching approximately 2 ms.
* "EXEC (ANALOG BOUND)" (Green) and "EXEC (DIGITAL BOUND)" (Red) are relatively low for most clusters, with some spikes.
* "SYNCHRONIZATION OVERHEAD" (Purple) is minimal.
**Part C: Latency Stacked Bar Chart (Cluster ID unspecified)**
* The chart shows latency breakdown for a series of cluster IDs.
* "COMMUNICATION OVERHEAD" (Blue) dominates the latency for most clusters, reaching up to approximately 8 ms.
* "IDLE" (Yellow) is relatively low for most clusters, reaching approximately 2 ms.
* "EXEC (ANALOG BOUND)" (Green) and "EXEC (DIGITAL BOUND)" (Red) are relatively low for most clusters.
* "SYNCHRONIZATION OVERHEAD" (Purple) is minimal.
**Part D: Latency Stacked Bar Chart (Specific Cluster IDs)**
* The chart shows latency breakdown for specific cluster IDs: 16, 2, 56, 28, 53, and 167.
* "IDLE" (Yellow) is a significant component of latency, varying across clusters, up to approximately 3 ms.
* "COMMUNICATION OVERHEAD" (Blue) increases with cluster ID, reaching approximately 1.5 ms.
* "EXEC (ANALOG BOUND)" (Green) varies significantly, with some clusters showing high values (up to 3 ms) and others showing low values.
* "EXEC (DIGITAL BOUND)" (Red) is generally low, with some spikes.
* "SYNCHRONIZATION OVERHEAD" (Purple) is relatively constant at approximately 0.5 ms.
### Key Observations
* Performance increases significantly from "naive" to "data-replication and parallelization" to "residual management".
* Latency breakdowns vary significantly across different cluster IDs and configurations.
* "IDLE" and "COMMUNICATION OVERHEAD" are major contributors to latency.
* "EXEC (ANALOG BOUND)" and "EXEC (DIGITAL BOUND)" show variability depending on the cluster.
### Interpretation
The data suggests that "residual management" offers the best performance (TOPS) compared to "naive" and "data-replication and parallelization" approaches. The latency breakdowns indicate that different computational strategies and cluster configurations result in varying latency profiles. The dominance of "IDLE" time in some configurations suggests potential areas for optimization. The increase in "COMMUNICATION OVERHEAD" with cluster ID in Part D may indicate scaling challenges. The variability in "EXEC (ANALOG BOUND)" and "EXEC (DIGITAL BOUND)" highlights the impact of specific cluster characteristics on execution time.