## Chart/Diagram Type: Technical Performance Analysis
### Overview
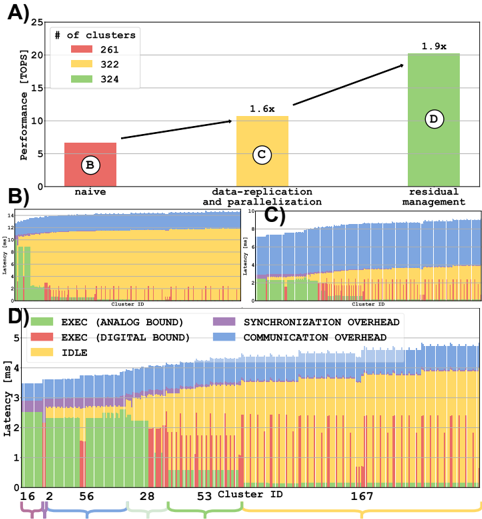
The image presents a multi-section technical analysis of system performance, including bar charts, stacked bar charts, and a line chart. It compares cluster performance, latency distribution, and overhead components across different configurations.
---
### Components/Axes
#### Section A: Bar Chart (Performance Comparison)
- **X-axis**: Cluster configurations labeled **B (261 clusters)**, **C (322 clusters)**, **D (324 clusters)**.
- **Y-axis**: Performance metric labeled **Performance (TOPS)**.
- **Legend**:
- **Red**: 261 clusters (B)
- **Orange**: 322 clusters (C)
- **Green**: 324 clusters (D)
- **Key Text**:
- "1.6x" (C vs. B)
- "1.9x" (D vs. B)
#### Section B: Stacked Bar Chart (Naive Configuration)
- **X-axis**: Unlabeled (likely cluster IDs or categories).
- **Y-axis**: Unlabeled (likely performance or resource usage).
- **Legend**:
- **Green**: EXEC (ANALOG BOUND)
- **Purple**: SYNCHRONIZATION OVERHEAD
- **Blue**: COMMUNICATION OVERHEAD
- **Yellow**: IDLE
- **Key Text**:
- "naive" (title)
#### Section C: Stacked Bar Chart (Data-Replication and Parallelization)
- **X-axis**: Unlabeled (likely cluster IDs or categories).
- **Y-axis**: Unlabeled (likely performance or resource usage).
- **Legend**:
- **Green**: EXEC (ANALOG BOUND)
- **Purple**: SYNCHRONIZATION OVERHEAD
- **Blue**: COMMUNICATION OVERHEAD
- **Yellow**: IDLE
- **Key Text**:
- "data-replication and parallelization" (title)
- "residual management" (title)
#### Section D: Line Chart (Latency Distribution)
- **X-axis**: Cluster IDs (16, 2, 56, 28, 53, 167).
- **Y-axis**: Latency (ms).
- **Legend**:
- **Green**: EXEC (ANALOG BOUND)
- **Purple**: SYNCHRONIZATION OVERHEAD
- **Blue**: COMMUNICATION OVERHEAD
- **Yellow**: IDLE
- **Key Text**:
- "LATENCY (ms)" (y-axis label)
---
### Detailed Analysis
#### Section A: Performance Comparison
- **Bar B (261 clusters)**: ~5 TOPS (red).
- **Bar C (322 clusters)**: ~8 TOPS (orange), 1.6x improvement over B.
- **Bar D (324 clusters)**: ~9.5 TOPS (green), 1.9x improvement over B.
#### Section B: Naive Configuration
- **Stacked Bars**:
- **Green (EXEC)**: Dominates the lower portion (e.g., ~3–4 units).
- **Purple (SYNCHRONIZATION)**: Middle portion (~1–2 units).
- **Blue (COMMUNICATION)**: Upper portion (~1–2 units).
- **Yellow (IDLE)**: Smallest segment (~0.5 units).
#### Section C: Data-Replication and Parallelization
- **Stacked Bars**:
- **Green (EXEC)**: Dominates (~3–4 units).
- **Purple (SYNCHRONIZATION)**: Middle (~1–2 units).
- **Blue (COMMUNICATION)**: Upper (~1–2 units).
- **Yellow (IDLE)**: Smallest (~0.5 units).
#### Section D: Latency Distribution
- **Lines**:
- **Green (EXEC)**: Lowest latency (~1–2 ms) across all clusters.
- **Purple (SYNCHRONIZATION)**: Moderate latency (~2–3 ms).
- **Blue (COMMUNICATION)**: Higher latency (~3–4 ms).
- **Yellow (IDLE)**: Highest latency (~4–5 ms).
- **Cluster IDs**:
- Cluster 16: Green line lowest, yellow highest.
- Cluster 167: Green line lowest, yellow highest.
---
### Key Observations
1. **Performance Scaling**: Increasing cluster count (B→D) improves performance (5→9.5 TOPS), but with diminishing returns (1.6x→1.9x).
2. **Overhead Breakdown**:
- **EXEC (ANALOG BOUND)** consistently dominates performance (green).
- **SYNCHRONIZATION OVERHEAD** and **COMMUNICATION OVERHEAD** are significant contributors to latency.
- **IDLE** time is minimal but present.
3. **Latency Trends**:
- **EXEC (ANALOG BOUND)** has the lowest latency, suggesting it is the most efficient component.
- **IDLE** time correlates with higher latency, indicating inefficiency.
---
### Interpretation
- **Performance vs. Overhead**: The system’s performance improves with more clusters, but the overhead (synchronization, communication) becomes a bottleneck. The "naive" configuration (B) shows high idle time, suggesting underutilization.
- **Latency Distribution**: The line chart (D) reveals that **EXEC (ANALOG BOUND)** is the most efficient, while **IDLE** time is the least efficient. This implies that optimizing synchronization and communication overhead could reduce latency.
- **Residual Management**: Section C’s "residual management" title suggests that unaccounted resources (e.g., idle time) are a focus for optimization.
The data highlights the trade-off between scaling cluster size and managing overhead, with **EXEC (ANALOG BOUND)** being the critical component for performance.