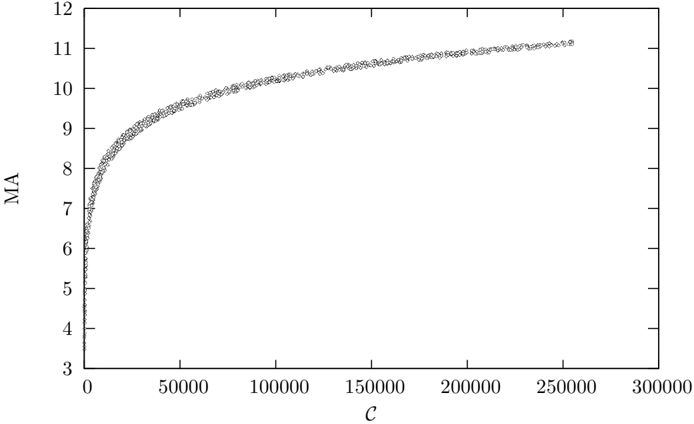
## Scatter Plot: Relationship Between C and MA
### Overview
The image depicts a scatter plot illustrating the relationship between two variables: **C** (x-axis) and **MA** (y-axis). The data points form a curve that begins with a steep upward trajectory, then gradually flattens as **C** increases. The plot suggests a saturation effect, where **MA** increases rapidly with **C** initially but plateaus at higher values of **C**.
---
### Components/Axes
- **Y-Axis (MA)**: Labeled "MA," scaled from 3 to 12 in increments of 1.
- **X-Axis (C)**: Labeled "C," scaled from 0 to 300,000 in increments of 50,000.
- **Data Points**: Black dots representing individual measurements.
- **No Legend**: No additional categories or color-coded data series are present.
---
### Detailed Analysis
1. **Initial Trend (C = 0 to 50,000)**:
- **MA** rises sharply from ~3 to ~8.
- Example data points:
- (0, 3)
- (50,000, 8)
2. **Mid-Range Trend (C = 50,000 to 150,000)**:
- **MA** continues to increase but at a slower rate, reaching ~10.
- Example data points:
- (100,000, 9.5)
- (150,000, 10)
3. **Saturation Phase (C = 150,000 to 250,000)**:
- **MA** plateaus between ~10 and ~11, showing minimal growth despite large increases in **C**.
- Example data points:
- (200,000, 10.5)
- (250,000, 11)
4. **Flattening Beyond 250,000**:
- The curve levels off completely, with **MA** remaining near 11 even as **C** approaches 300,000.
---
### Key Observations
- **Saturation Effect**: **MA** exhibits diminishing returns as **C** increases, indicating a maximum capacity or limit.
- **Inflection Point**: The steepest growth occurs between **C = 0** and **C = 50,000**, after which the rate of increase slows significantly.
- **Asymptotic Behavior**: The curve approaches a horizontal asymptote at **MA ≈ 11**, suggesting a theoretical upper bound.
---
### Interpretation
The data implies that **MA** is highly sensitive to **C** in its early stages but becomes less responsive as **C** grows. This could reflect phenomena such as:
- **Resource Allocation**: Initial investments in **C** yield significant improvements in **MA**, but further investments yield diminishing returns.
- **System Capacity**: **MA** may represent a system's output or performance metric that saturates at a critical threshold of **C**.
- **Biological/Physical Processes**: Analogous to enzyme kinetics or material stress-strain curves, where initial gains are rapid but plateau due to inherent limits.
The absence of a legend or additional context limits the ability to confirm the exact nature of **C** and **MA**, but the trend strongly suggests a saturation model. Outliers or anomalies are not evident in the provided data.