# Technical Document Extraction: Scatter Plot Analysis
## Image Description
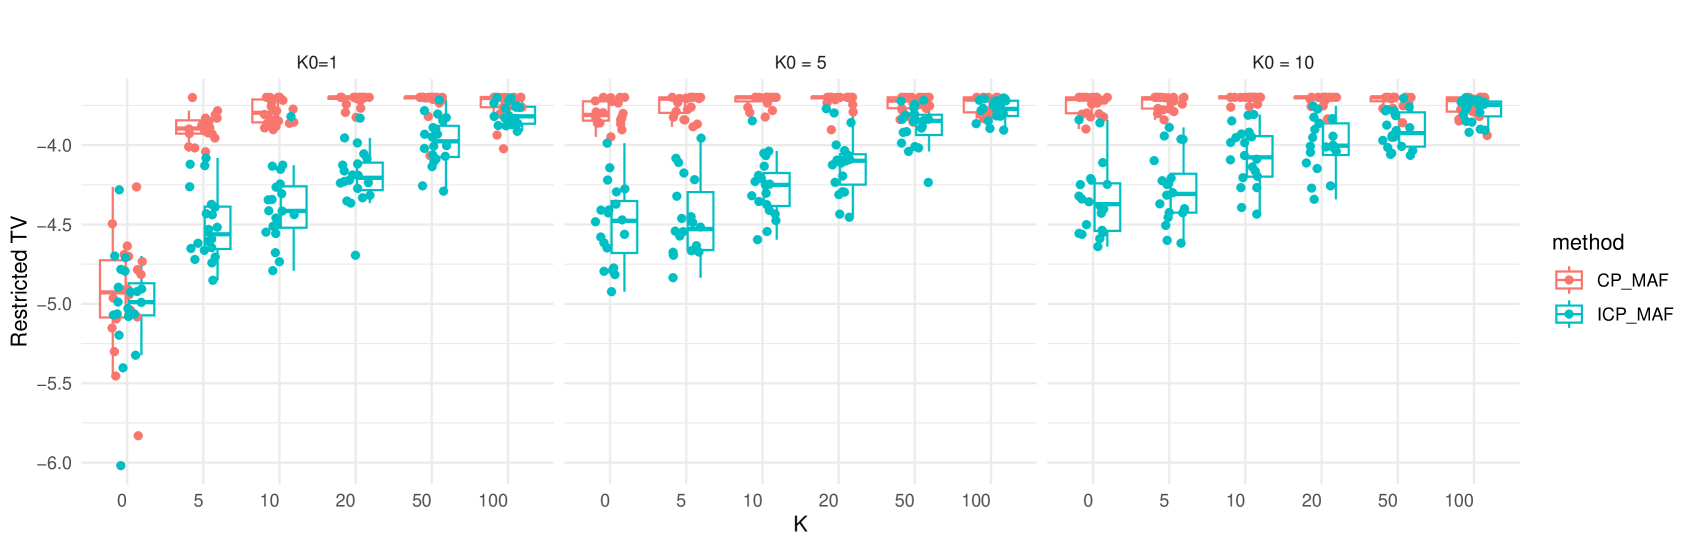
The image is a comparative scatter plot with box plots, analyzing two statistical methods (`CP_MAF` and `ICP_MAF`) across varying values of `K` under three distinct `K0` settings (`K0=1`, `K0=5`, `K0=10`). The y-axis represents "Restricted TV" (Total Variation), and the x-axis represents `K` (a parameter ranging from 0 to 100). The plot is divided into three horizontal sections, each corresponding to a `K0` value.
---
## Key Components
### 1. **Axes and Labels**
- **X-axis**: Labeled `K`, with discrete values at `0, 5, 10, 20, 50, 100`.
- **Y-axis**: Labeled `Restricted TV`, with values ranging from `-6.0` to `-4.0` in increments of `0.5`.
- **Legend**: Located in the **right-middle** of the plot, with:
- **Red squares**: `CP_MAF` method.
- **Cyan squares**: `ICP_MAF` method.
### 2. **Sections by `K0`**
The plot is segmented into three horizontal regions, each with a title indicating the `K0` value:
- **Top Section**: `K0 = 1`
- **Middle Section**: `K0 = 5`
- **Bottom Section**: `K0 = 10`
Each section contains scatter points and box plots for `CP_MAF` (red) and `ICP_MAF` (cyan) across the `K` values.
---
## Data Trends and Observations
### 1. **`K0 = 1`**
- **`CP_MAF` (Red)**:
- Starts at `K=0` with a median Restricted TV of approximately `-5.0`.
- Shows a slight upward trend as `K` increases, reaching a median of `-4.5` at `K=100`.
- Outliers are sparse but present at lower `K` values (e.g., `K=0` has points near `-5.5`).
- **`ICP_MAF` (Cyan)**:
- Begins at `K=0` with a median of `-5.5`, higher than `CP_MAF`.
- Exhibits a steeper upward trend, reaching a median of `-4.5` at `K=100`.
- More outliers at lower `K` values (e.g., `K=0` has points near `-6.0`).
### 2. **`K0 = 5`**
- **`CP_MAF` (Red)**:
- Starts at `K=0` with a median of `-5.0`.
- Shows a gradual increase, stabilizing around `-4.5` at `K=100`.
- Fewer outliers compared to `K0=1`.
- **`ICP_MAF` (Cyan)**:
- Begins at `K=0` with a median of `-5.0`.
- Follows a similar upward trend to `CP_MAF`, with tighter clustering at higher `K` values.
- Outliers are less frequent than in `K0=1`.
### 3. **`K0 = 10`**
- **`CP_MAF` (Red)**:
- Starts at `K=0` with a median of `-5.0`.
- Maintains a consistent upward trend, reaching `-4.5` at `K=100`.
- Minimal outliers across all `K` values.
- **`ICP_MAF` (Cyan)**:
- Begins at `K=0` with a median of `-5.0`.
- Shows a slightly steeper increase than `CP_MAF`, stabilizing at `-4.5` at `K=100`.
- Outliers are rare, with tighter clustering than in `K0=5`.
---
## Spatial Grounding and Color Verification
- **Legend Position**: Right-middle of the plot.
- **Color Consistency**:
- All red data points correspond to `CP_MAF`.
- All cyan data points correspond to `ICP_MAF`.
- Box plots for each method match their respective colors.
---
## Summary of Key Data Points
| K0 | Method | K Value | Median Restricted TV | Notable Trends |
|----|-----------|---------|----------------------|-------------------------------|
| 1 | CP_MAF | 0 | -5.0 | Slight upward trend |
| 1 | ICP_MAF | 0 | -5.5 | Steeper upward trend |
| 5 | CP_MAF | 0 | -5.0 | Gradual increase |
| 5 | ICP_MAF | 0 | -5.0 | Tighter clustering at high K |
| 10 | CP_MAF | 0 | -5.0 | Minimal outliers |
| 10 | ICP_MAF | 0 | -5.0 | Steeper increase than CP_MAF |
---
## Conclusion
The plot demonstrates that both `CP_MAF` and `ICP_MAF` methods show improved performance (higher Restricted TV) as `K` increases, with `ICP_MAF` generally outperforming `CP_MAF` across all `K0` settings. The effect is most pronounced at lower `K0` values (`K0=1`), where `ICP_MAF` exhibits a steeper upward trend. At higher `K0` values (`K0=10`), the performance gap narrows, with both methods converging toward similar Restricted TV values.