## Time Series Chart: Activity Signal Data
### Overview
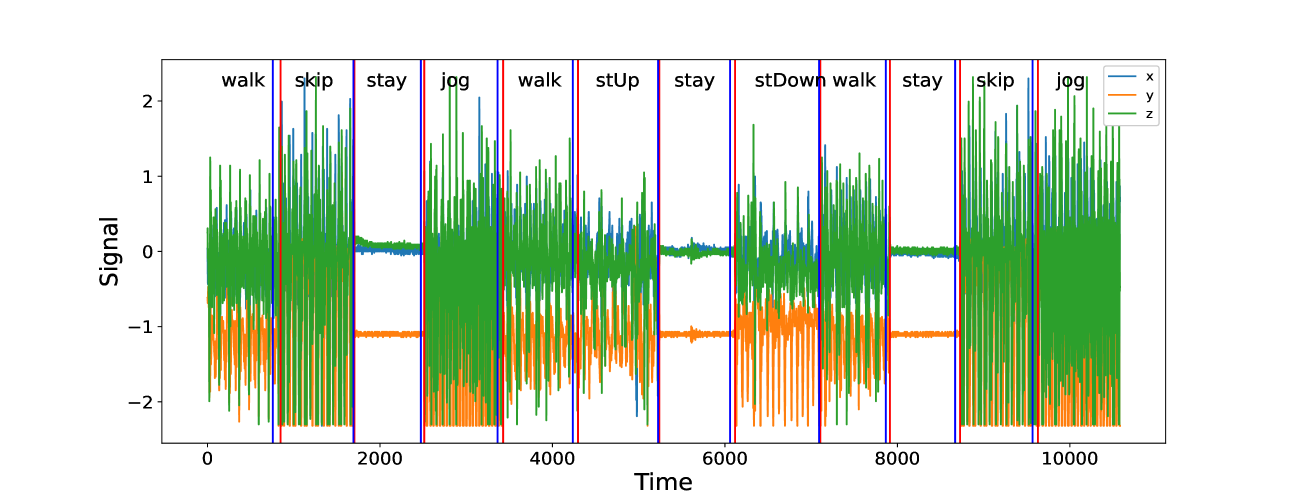
The image is a time series chart displaying signal data across three axes (x, y, z) over a period of time. The chart is annotated with labels indicating different activities performed during the recording period, such as walking, skipping, staying, jogging, and going up or down stairs. The data appears to be sensor data, possibly from an accelerometer or similar device.
### Components/Axes
* **X-axis:** "Time", with a scale from 0 to 10000. Axis markers are present at 0, 2000, 4000, 6000, 8000, and 10000.
* **Y-axis:** "Signal", with a scale from -2 to 2. Axis markers are present at -2, -1, 0, 1, and 2.
* **Data Series:**
* **x (blue):** Varies between approximately 0 and 1.
* **y (orange):** Varies between approximately -2 and 0.
* **z (green):** Varies between approximately -2 and 2.
* **Activity Labels:** "walk", "skip", "stay", "jog", "stUp", "stDown" are placed above the chart, indicating the activity being performed during that time interval. These labels are separated by vertical lines.
* **Vertical Lines:** Red and blue vertical lines separate the different activity segments.
### Detailed Analysis
* **Walk (0-1000):**
* x (blue): Oscillates between approximately 0 and 1.
* y (orange): Oscillates between approximately -2 and -1.
* z (green): Oscillates between approximately -1 and 2.
* **Skip (1000-2000):**
* x (blue): Oscillates between approximately 0 and 1.
* y (orange): Oscillates between approximately -2 and -1.
* z (green): Oscillates between approximately -1 and 2.
* **Stay (2000-3000):**
* x (blue): Remains relatively constant at approximately 0.
* y (orange): Remains relatively constant at approximately -1.
* z (green): Remains relatively constant at approximately 0.5.
* **Jog (3000-4000):**
* x (blue): Oscillates between approximately 0 and 1.
* y (orange): Oscillates between approximately -2 and -1.
* z (green): Oscillates between approximately -1 and 2.
* **Walk (4000-5000):**
* x (blue): Oscillates between approximately 0 and 1.
* y (orange): Oscillates between approximately -2 and -1.
* z (green): Oscillates between approximately -1 and 2.
* **stUp (5000-6000):**
* x (blue): Oscillates between approximately 0 and 1.
* y (orange): Oscillates between approximately -2 and -1.
* z (green): Oscillates between approximately -1 and 2.
* **Stay (6000-7000):**
* x (blue): Remains relatively constant at approximately 0.
* y (orange): Remains relatively constant at approximately -1.
* z (green): Remains relatively constant at approximately 0.
* **stDown (7000-8000):**
* x (blue): Oscillates between approximately 0 and 1.
* y (orange): Oscillates between approximately -2 and -1.
* z (green): Oscillates between approximately -1 and 2.
* **Walk (8000-9000):**
* x (blue): Oscillates between approximately 0 and 1.
* y (orange): Oscillates between approximately -2 and -1.
* z (green): Oscillates between approximately -1 and 2.
* **Stay (9000-10000):**
* x (blue): Remains relatively constant at approximately 0.
* y (orange): Remains relatively constant at approximately -1.
* z (green): Remains relatively constant at approximately 0.
* **Jog (10000-):**
* x (blue): Oscillates between approximately 0 and 1.
* y (orange): Oscillates between approximately -2 and -1.
* z (green): Oscillates between approximately -1 and 2.
* **Skip (10000-):**
* x (blue): Oscillates between approximately 0 and 1.
* y (orange): Oscillates between approximately -2 and -1.
* z (green): Oscillates between approximately -1 and 2.
### Key Observations
* The "stay" activity segments are characterized by relatively constant signal values for all three axes.
* The "walk", "skip", "jog", "stUp", and "stDown" activities are characterized by oscillations in all three axes.
* The z-axis (green) shows the most significant variation during the active periods.
* The y-axis (orange) consistently shows negative values.
* The x-axis (blue) consistently shows values around 0.
### Interpretation
The chart visualizes sensor data that can be used to differentiate between different human activities. The "stay" activity serves as a baseline, while the other activities generate distinct oscillatory patterns in the signal data. The z-axis appears to be the most sensitive to movement, while the y-axis might be related to gravity or a constant force. The data suggests that it is possible to classify these activities using machine learning techniques based on the patterns observed in the signal data. The consistent patterns within each activity type suggest a degree of repeatability and reliability in the sensor readings.