TECHNICAL ASSET FINGERPRINT
92087ec9e16bc28bf68bd8e5
Click to view fullscreen
Press ESC or click to close
FOUND IN PAPERS
EXPERT: healer-alpha-free VERSION 1
RUNTIME: free/openrouter/healer-alpha
INTEL_VERIFIED
\n
## Time-Series Chart: Multi-Signal Activity Segmentation
### Overview
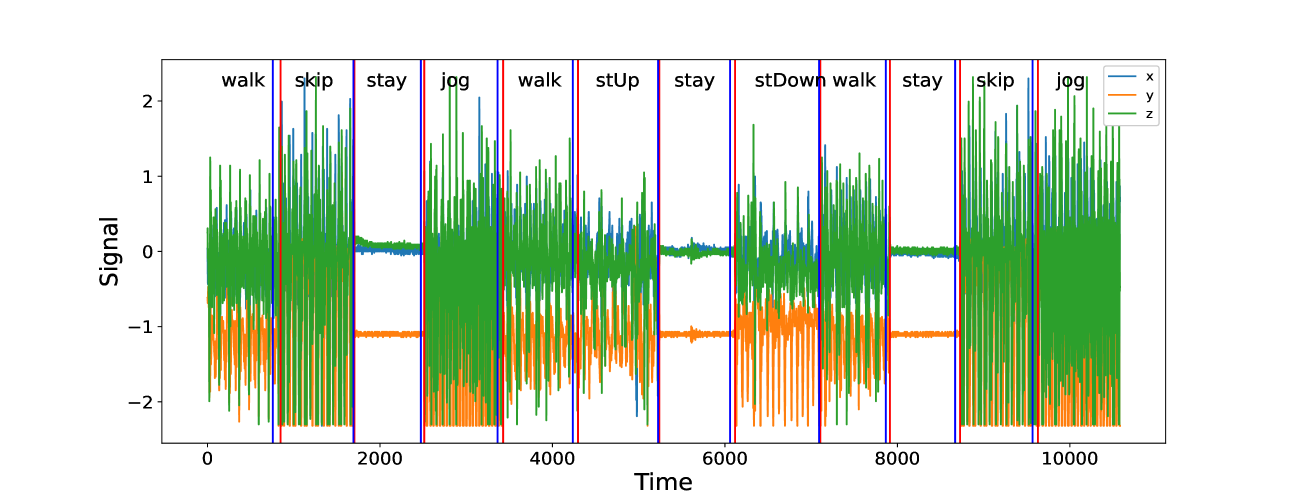
The image displays a time-series plot containing three continuous signals (x, y, z) recorded over a period of approximately 10,500 time units. The data is segmented into distinct temporal regions, each labeled with a specific physical activity. Vertical lines of different colors demarcate the boundaries between these activity segments.
### Components/Axes
* **Chart Type:** Multi-line time-series plot with activity segmentation.
* **X-Axis:** Labeled "Time". The scale runs from 0 to just beyond 10,000, with major tick marks at 0, 2000, 4000, 6000, 8000, and 10000.
* **Y-Axis:** Labeled "Signal". The scale runs from -2 to 2, with major tick marks at -2, -1, 0, 1, and 2.
* **Legend:** Located in the top-right corner of the plot area. It defines three data series:
* `x` (blue line)
* `y` (orange line)
* `z` (green line)
* **Activity Segments & Boundaries:** The plot is divided by vertical lines. The color of the line appears to correspond to the activity type. The segments, from left to right, are:
1. **walk** (Start ~0, End ~1200). Bounded by a red vertical line on the right.
2. **skip** (Start ~1200, End ~2000). Bounded by a blue vertical line on the right.
3. **stay** (Start ~2000, End ~2800). Bounded by a red vertical line on the right.
4. **jog** (Start ~2800, End ~3800). Bounded by a blue vertical line on the right.
5. **walk** (Start ~3800, End ~4800). Bounded by a purple vertical line on the right.
6. **stUp** (Start ~4800, End ~5600). Bounded by a purple vertical line on the right.
7. **stay** (Start ~5600, End ~6400). Bounded by a red vertical line on the right.
8. **stDown** (Start ~6400, End ~7200). Bounded by a blue vertical line on the right.
9. **walk** (Start ~7200, End ~8000). Bounded by a purple vertical line on the right.
10. **stay** (Start ~8000, End ~8800). Bounded by a red vertical line on the right.
11. **skip** (Start ~8800, End ~9600). Bounded by a blue vertical line on the right.
12. **jog** (Start ~9600, End ~10500+).
### Detailed Analysis
**Signal Behavior by Activity Segment:**
1. **walk (0-1200):**
* **z (green):** High-amplitude, regular oscillations between approx. -1.5 and +1.5.
* **y (orange):** Consistently negative, oscillating between approx. -1.0 and -2.0.
* **x (blue):** Low-amplitude noise centered around 0.
2. **skip (1200-2000):**
* **z (green):** Very high-amplitude, dense oscillations, frequently exceeding the plot limits (clipping at ±2).
* **y (orange):** Similar to the first walk segment, negative and oscillating.
* **x (blue):** Low-amplitude noise around 0.
3. **stay (2000-2800):**
* **All signals (x, y, z):** Flat lines with minimal noise. `z` and `x` are near 0. `y` is stable at approximately -1.1.
4. **jog (2800-3800):**
* **z (green):** Extremely high-frequency, high-amplitude oscillations, consistently clipping at the plot limits (±2).
* **y (orange):** High-amplitude oscillations, ranging from approx. -2.0 to 0.
* **x (blue):** Shows more activity than in walk/skip, with oscillations between approx. -0.5 and +0.5.
5. **walk (3800-4800):**
* Similar pattern to the first walk segment. `z` oscillates strongly, `y` is negative, `x` is low-noise.
6. **stUp (4800-5600):**
* **z (green):** Moderate oscillations, amplitude lower than walking.
* **y (orange):** Shows a distinct pattern: a sharp negative spike at the start, followed by oscillations between approx. -1.5 and -0.5.
* **x (blue):** Low-amplitude oscillations.
7. **stay (5600-6400):**
* Flat lines, nearly identical to the first "stay" segment. `y` holds at ~-1.1.
8. **stDown (6400-7200):**
* **z (green):** Moderate oscillations.
* **y (orange):** Distinct pattern with a positive spike at the start, followed by oscillations between approx. -1.5 and 0.
* **x (blue):** Low-amplitude oscillations.
9. **walk (7200-8000):**
* Consistent with previous walk segments.
10. **stay (8000-8800):**
* Flat lines, consistent with previous stay segments.
11. **skip (8800-9600):**
* Consistent with the first skip segment: very high-amplitude `z` and `y` signals.
12. **jog (9600-10500+):**
* Consistent with the first jog segment: maximum amplitude, high-frequency oscillations in `z` and `y`.
### Key Observations
* **Clear Signal Differentiation:** Each activity produces a distinct signature across the three signal axes. "Stay" is characterized by flat lines. "Walk," "skip," and "jog" show progressively higher amplitude and frequency in the `z` (green) signal.
* **Consistent `y` (orange) Offset:** During all dynamic activities (walk, skip, jog, stUp, stDown), the `y` signal is predominantly negative. During static "stay" periods, it holds a stable negative value (~-1.1).
* **Segment Boundary Precision:** The transitions between activities are abrupt, as indicated by the immediate change in signal patterns at the vertical boundary lines.
* **Signal Clipping:** The `z` signal during "skip" and "jog" activities frequently exceeds the plotted range of -2 to 2, indicating the sensor's output may have saturated.
### Interpretation
This chart almost certainly represents **tri-axial accelerometer data** (where x, y, z correspond to physical axes) collected during a sequence of human activities. The data is likely from a wearable sensor (e.g., on the waist or wrist).
* **What the data demonstrates:** The distinct signal patterns serve as a "fingerprint" for each activity. This is the foundational data used to train machine learning models for **Human Activity Recognition (HAR)**. The clear segmentation suggests this is either labeled training data or the output of a perfect activity classifier.
* **Relationship between elements:** The vertical lines and labels provide the "ground truth" annotation for the raw sensor signals. The `y` axis's consistent negative bias during movement might indicate the sensor's orientation relative to gravity. The `z` axis appears to be the primary axis of motion for these activities.
* **Notable patterns/anomalies:**
* The "stUp" (stand up) and "stDown" (sit/lie down) segments show unique transient spikes in the `y` signal, capturing the specific motion of changing posture.
* The near-perfect flatness during "stay" segments indicates the subject was completely still, which is ideal for calibration.
* The clipping during "jog" and "skip" is a practical data quality issue; in a real-world application, this would necessitate adjusting the sensor's measurement range.
DECODING INTELLIGENCE...