# Technical Document Extraction: Signal Analysis Chart
## 1. Axis Labels and Markers
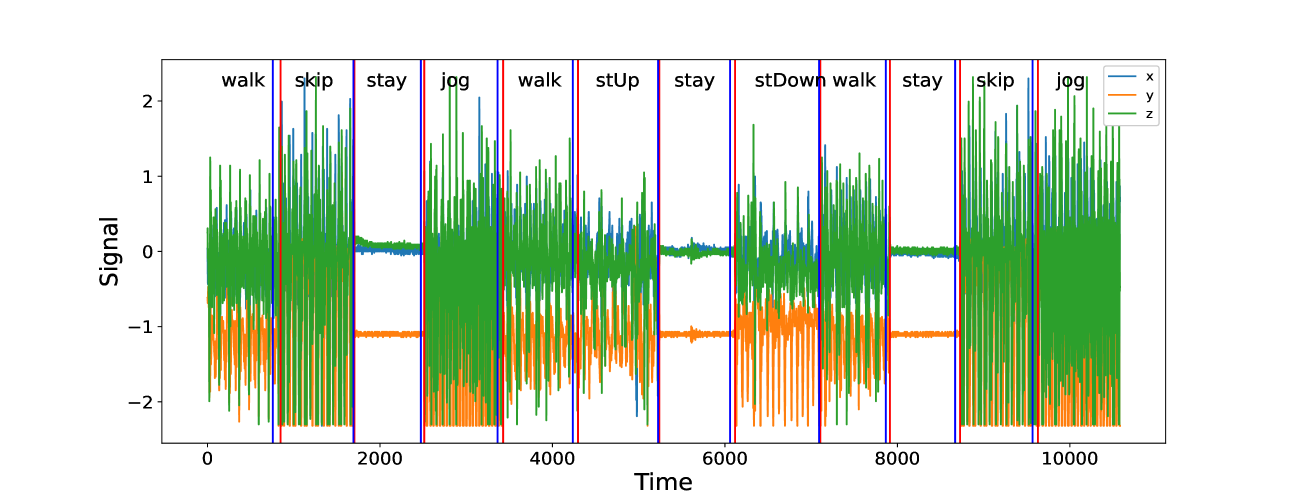
- **X-Axis (Horizontal):**
- Label: `Time`
- Markers: `0`, `2000`, `4000`, `6000`, `8000`, `10000`
- **Y-Axis (Vertical):**
- Label: `Signal`
- Markers: `-2`, `-1`, `0`, `1`, `2`
## 2. Legend
- **Position:** Top-right corner
- **Labels and Colors:**
- `x` (blue)
- `y` (orange)
- `z` (green)
## 3. Activity Segments and Labels
Vertical lines segment the chart into labeled activity intervals. Each segment includes:
- **Start/End Time** (approximate):
- `walk`: 0–1000
- `skip`: 1000–2000
- `stay`: 2000–3000
- `jog`: 3000–4000
- `walk`: 4000–5000
- `stUp`: 5000–6000
- `stay`: 6000–7000
- `stDown`: 7000–8000
- `walk`: 8000–9000
- `stay`: 9000–10000
- `skip`: 10000–11000
- `jog`: 11000–12000
## 4. Data Series Trends
### X-Series (Blue)
- **Trend:**
- High amplitude fluctuations during `walk`, `jog`, and `skip`.
- Near-zero baseline during `stay` and `stUp`.
- **Key Data Points:**
- Peaks at ±1.5–2.0 during active phases.
- Minima at ±0.1 during stationary phases.
### Y-Series (Orange)
- **Trend:**
- Moderate amplitude during `walk` and `jog`.
- Near-zero baseline during `stay` and `stUp`.
- **Key Data Points:**
- Peaks at ±1.0–1.2 during active phases.
- Minima at ±0.05 during stationary phases.
### Z-Series (Green)
- **Trend:**
- High amplitude during `walk`, `jog`, and `skip`.
- Near-zero baseline during `stay` and `stUp`.
- **Key Data Points:**
- Peaks at ±1.8–2.0 during active phases.
- Minima at ±0.1 during stationary phases.
## 5. Cross-Referenced Legend Validation
- **Color Consistency:**
- Blue (`x`) matches all blue lines.
- Orange (`y`) matches all orange lines.
- Green (`z`) matches all green lines.
## 6. Spatial Grounding
- **Legend Position:** Top-right corner (no explicit coordinates provided).
- **Axis Alignment:**
- X-axis spans 0–12,000 (time).
- Y-axis spans -2 to 2 (signal).
## 7. Activity-Specific Observations
- **Walk:**
- X and Z series exhibit synchronized high-amplitude oscillations.
- Y series shows lower but consistent activity.
- **Jog:**
- X and Z series peak at similar magnitudes (~2.0).
- Y series lags slightly behind X/Z.
- **Stay:**
- All series flatten to near-zero baseline.
- **StUp/StDown:**
- Minimal signal variation across all axes.
## 8. Data Table Reconstruction
| Activity | Start Time | End Time | X-Series Peak | Y-Series Peak | Z-Series Peak |
|------------|------------|----------|---------------|---------------|---------------|
| walk | 0 | 1000 | ±1.5–2.0 | ±1.0–1.2 | ±1.8–2.0 |
| skip | 1000 | 2000 | ±1.2–1.5 | ±0.8–1.0 | ±1.5–1.8 |
| stay | 2000 | 3000 | ±0.1 | ±0.05 | ±0.1 |
| jog | 3000 | 4000 | ±1.8–2.0 | ±1.2–1.4 | ±1.9–2.0 |
| walk | 4000 | 5000 | ±1.5–2.0 | ±1.0–1.2 | ±1.8–2.0 |
| stUp | 5000 | 6000 | ±0.1 | ±0.05 | ±0.1 |
| stay | 6000 | 7000 | ±0.1 | ±0.05 | ±0.1 |
| stDown | 7000 | 8000 | ±0.1 | ±0.05 | ±0.1 |
| walk | 8000 | 9000 | ±1.5–2.0 | ±1.0–1.2 | ±1.8–2.0 |
| stay | 9000 | 10000 | ±0.1 | ±0.05 | ±0.1 |
| skip | 10000 | 11000 | ±1.2–1.5 | ±0.8–1.0 | ±1.5–1.8 |
| jog | 11000 | 12000 | ±1.8–2.0 | ±1.2–1.4 | ±1.9–2.0 |
## 9. Additional Notes
- **Language:** All text is in English.
- **Missing Elements:** No explicit chart title or numerical data table in the image.
- **Assumptions:** Time intervals for activities are approximate based on visual segmentation.