## Line Chart: Qwen3-8B Performance Analysis
### Overview
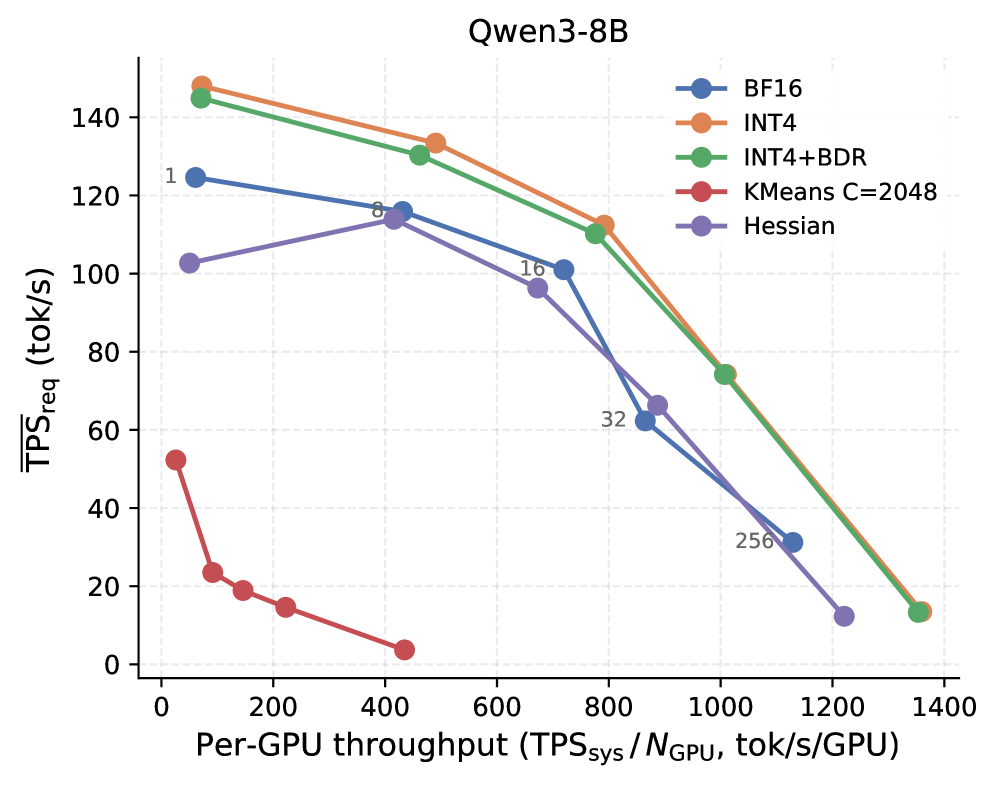
The chart compares the performance of different quantization methods (BF16, INT4, INT4+BDR, KMeans C=2048, Hessian) for the Qwen3-8B model. It plots **request throughput (TPS_req)** against **per-GPU throughput (TPS_sys/N_GPU)**. All lines show declining trends, with KMeans C=2048 performing significantly worse than others.
### Components/Axes
- **X-axis**: Per-GPU throughput (TPS_sys/N_GPU, tok/s/GPU)
- Range: 0 to 1400
- Labels: 0, 200, 400, 600, 800, 1000, 1200, 1400
- **Y-axis**: TPS_req (tok/s)
- Range: 0 to 140
- Labels: 0, 20, 40, 60, 80, 100, 120, 140
- **Legend**: Top-right corner
- Colors:
- Blue: BF16
- Orange: INT4
- Green: INT4+BDR
- Red: KMeans C=2048
- Purple: Hessian
### Detailed Analysis
1. **BF16 (Blue Line)**
- Starts at ~120 TPS_req at 1 tok/s/GPU.
- Declines steadily to ~30 TPS_req at 1200 tok/s/GPU.
- Slope: Gradual, linear decrease.
2. **INT4 (Orange Line)**
- Starts at ~145 TPS_req at 1 tok/s/GPU.
- Drops sharply to ~15 TPS_req at 1400 tok/s/GPU.
- Slope: Steeper than BF16, nonlinear decline.
3. **INT4+BDR (Green Line)**
- Starts at ~140 TPS_req at 1 tok/s/GPU.
- Declines to ~15 TPS_req at 1400 tok/s/GPU.
- Slope: Similar to INT4 but slightly less steep.
4. **KMeans C=2048 (Red Line)**
- Starts at ~50 TPS_req at 1 tok/s/GPU.
- Drops to ~5 TPS_req at 400 tok/s/GPU, then plateaus.
- Slope: Steepest decline, flat after 400.
5. **Hessian (Purple Line)**
- Starts at ~100 TPS_req at 1 tok/s/GPU.
- Peaks at ~115 TPS_req at 400 tok/s/GPU.
- Drops sharply to ~15 TPS_req at 1200 tok/s/GPU.
- Slope: Nonlinear with a distinct peak.
### Key Observations
- **KMeans C=2048** (red) is the lowest-performing method across all throughputs.
- **INT4** (orange) and **INT4+BDR** (green) achieve the highest initial TPS_req but degrade rapidly.
- **Hessian** (purple) shows an anomalous peak at 400 tok/s/GPU, suggesting a non-monotonic relationship.
- All methods except KMeans follow a similar downward trend, indicating diminishing returns with increased throughput.
### Interpretation
The data demonstrates that quantization methods like INT4 and INT4+BDR initially outperform BF16 but suffer significant performance degradation at higher throughputs. The Hessian method’s peak at 400 tok/s/GPU suggests an optimal operating point before efficiency drops, possibly due to computational overhead. KMeans C=2048’s flatline after 400 tok/s/GPU indicates it is fundamentally limited by its configuration, making it unsuitable for high-throughput scenarios. The divergence between methods highlights trade-offs between quantization efficiency and scalability, with BF16 offering the most stable but lower performance.