\n
## Line Chart: Transaction Fee vs. Number of Transactions
### Overview
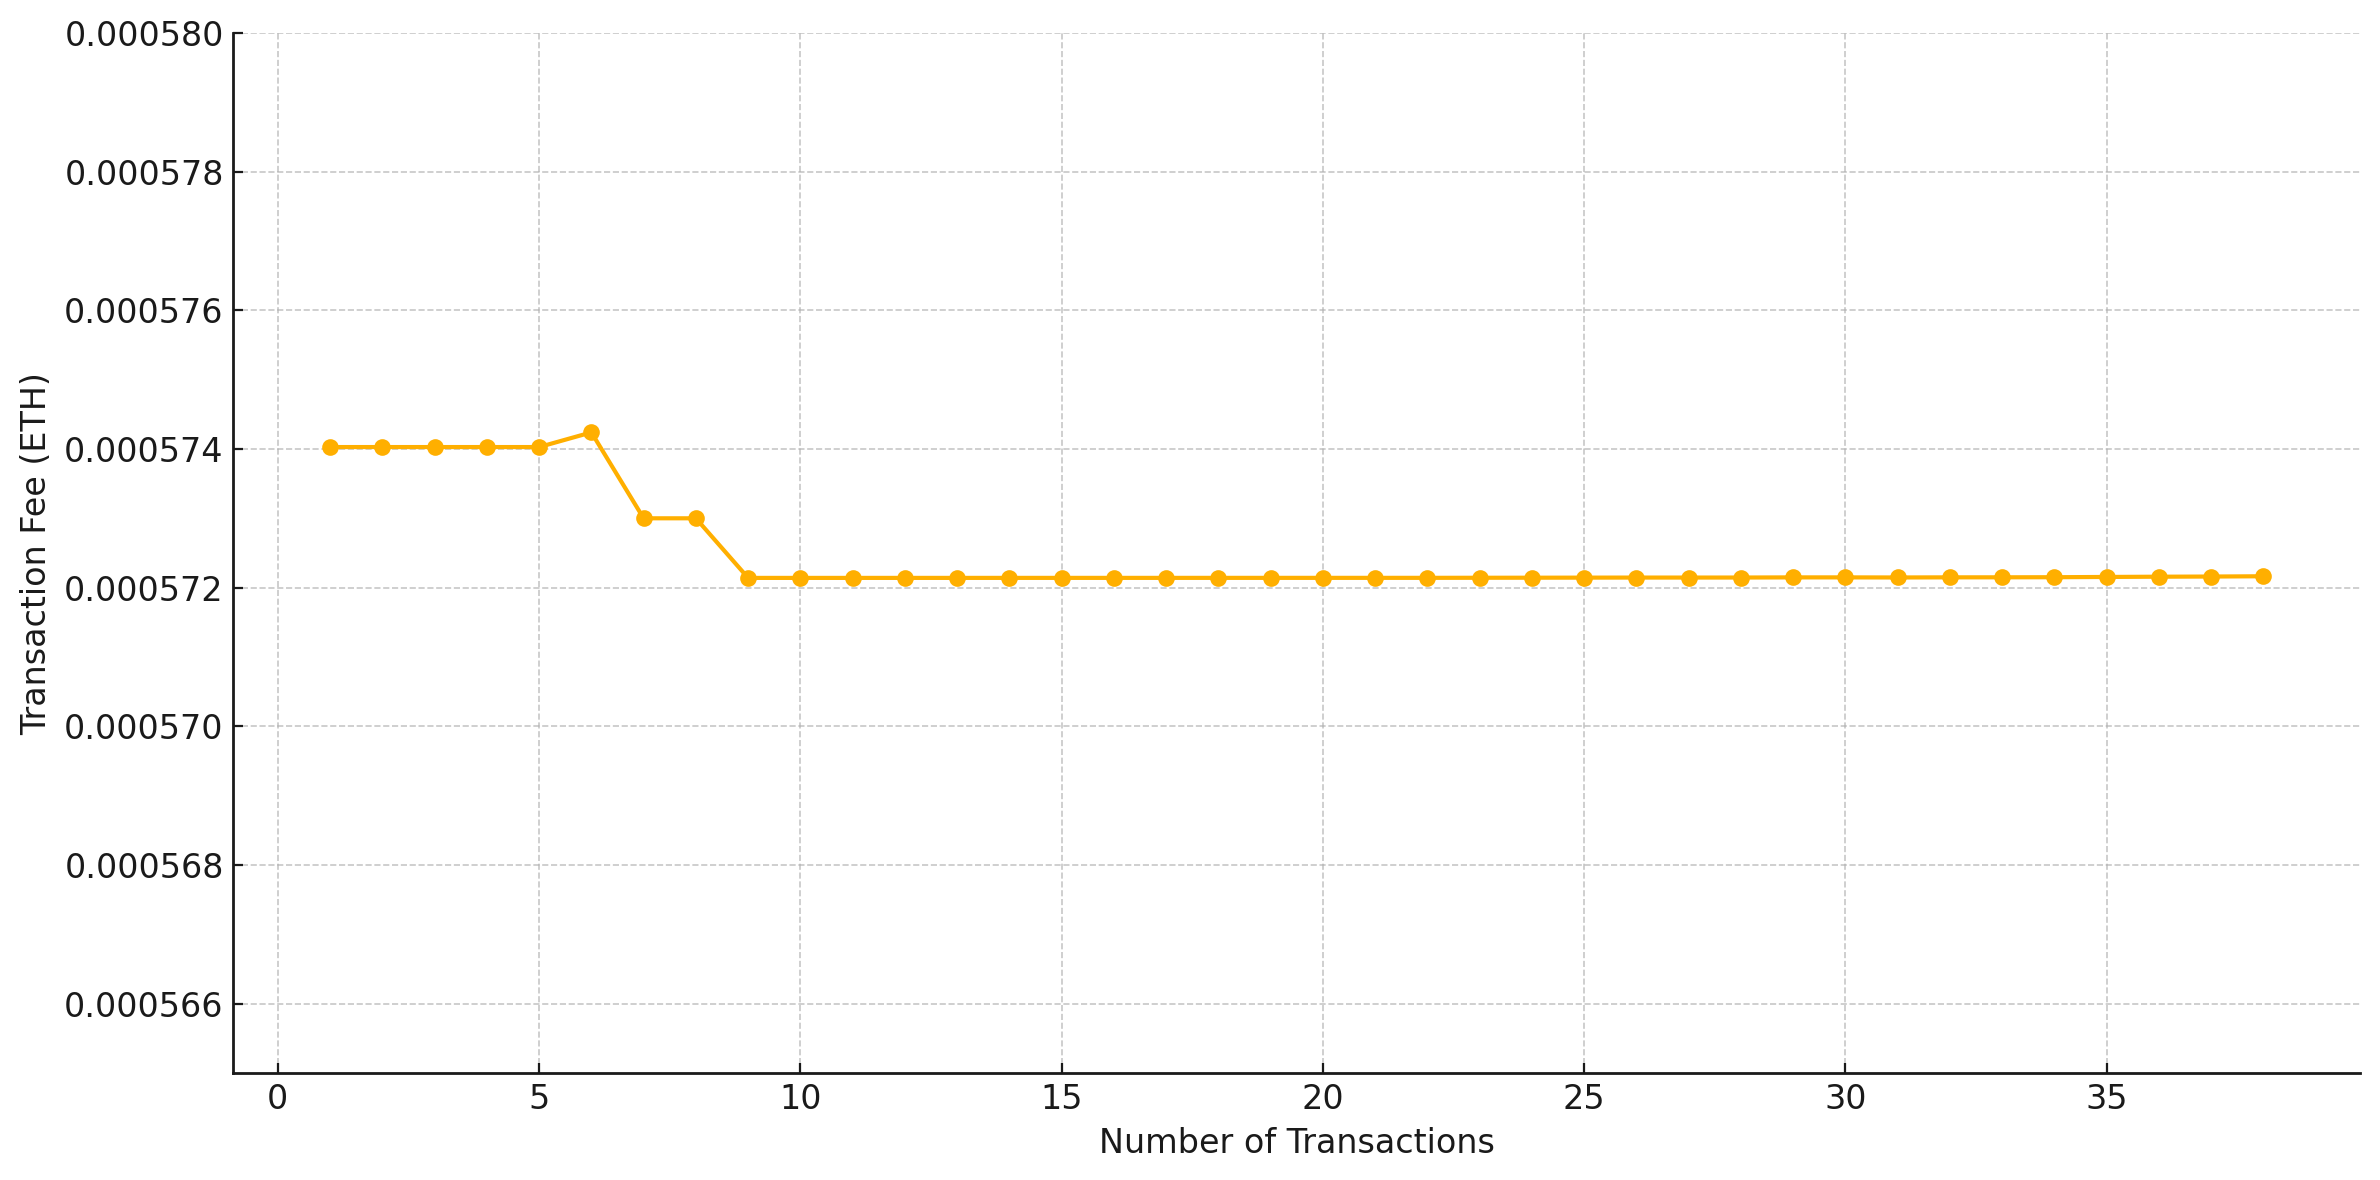
The image presents a line chart illustrating the relationship between the number of transactions and the corresponding transaction fee in ETH. The chart displays a decreasing trend in transaction fee initially, followed by a relatively stable period.
### Components/Axes
* **X-axis:** Number of Transactions, ranging from 0 to 35.
* **Y-axis:** Transaction Fee (ETH), ranging from approximately 0.000566 to 0.000580.
* **Data Series:** A single orange line representing the transaction fee.
* **Gridlines:** Horizontal and vertical gridlines are present to aid in reading values.
### Detailed Analysis
The orange line starts at approximately 0.000574 ETH at 0 transactions. It remains relatively constant until around 5 transactions. From 5 to 10 transactions, the line exhibits a sharp decrease, dropping to approximately 0.000571 ETH. After 10 transactions, the line stabilizes and fluctuates slightly around 0.000572 ETH, with minimal variation until 35 transactions, where it remains at approximately 0.000572 ETH.
Here's a breakdown of approximate data points:
* 0 Transactions: 0.000574 ETH
* 5 Transactions: 0.000574 ETH
* 10 Transactions: 0.000571 ETH
* 15 Transactions: 0.000572 ETH
* 20 Transactions: 0.000572 ETH
* 25 Transactions: 0.000572 ETH
* 30 Transactions: 0.000572 ETH
* 35 Transactions: 0.000572 ETH
### Key Observations
The most notable observation is the initial decrease in transaction fee as the number of transactions increases from 5 to 10. After this initial drop, the transaction fee remains remarkably stable, indicating a potential saturation point or a mechanism that regulates fees based on transaction volume. There are no significant outliers or anomalies beyond the initial decrease.
### Interpretation
The data suggests that there's an inverse relationship between the number of transactions and the transaction fee, at least up to a certain point. The initial decrease could be due to network effects or increased efficiency as more transactions are processed. However, the stabilization of the fee after 10 transactions implies that the network has reached a point where further increases in transaction volume do not significantly impact the fee. This could be due to limitations in block size, gas limits, or the fee market dynamics within the Ethereum network. The consistent fee suggests a relatively stable demand and supply balance for block space. The chart provides insight into the fee structure of the Ethereum network and how it responds to changes in transaction volume.